
Billions of dollars sit inside onchain vaults across multiple blockchains. Until now, anyone trying to compare those vaults side by side had to scrape protocol pages, normalise inconsistent fee structures, and rebuild risk metrics from raw events. Investment decisions in this market deserve better inputs than that.
That is why we built the Trading Strategy DeFi vault datasets, now available with a Pro subscription tier.
- The free tier: web dashboard remains free and covers thousands of vaults with daily updates, equity curves, and portfolio metrics.
- The Pro tier at $199 per month opens up the full machinery underneath: historical data, raw data files, the Python backtesting framework, BTC and ETH-denominated vaults on request, and support.
Why this is important
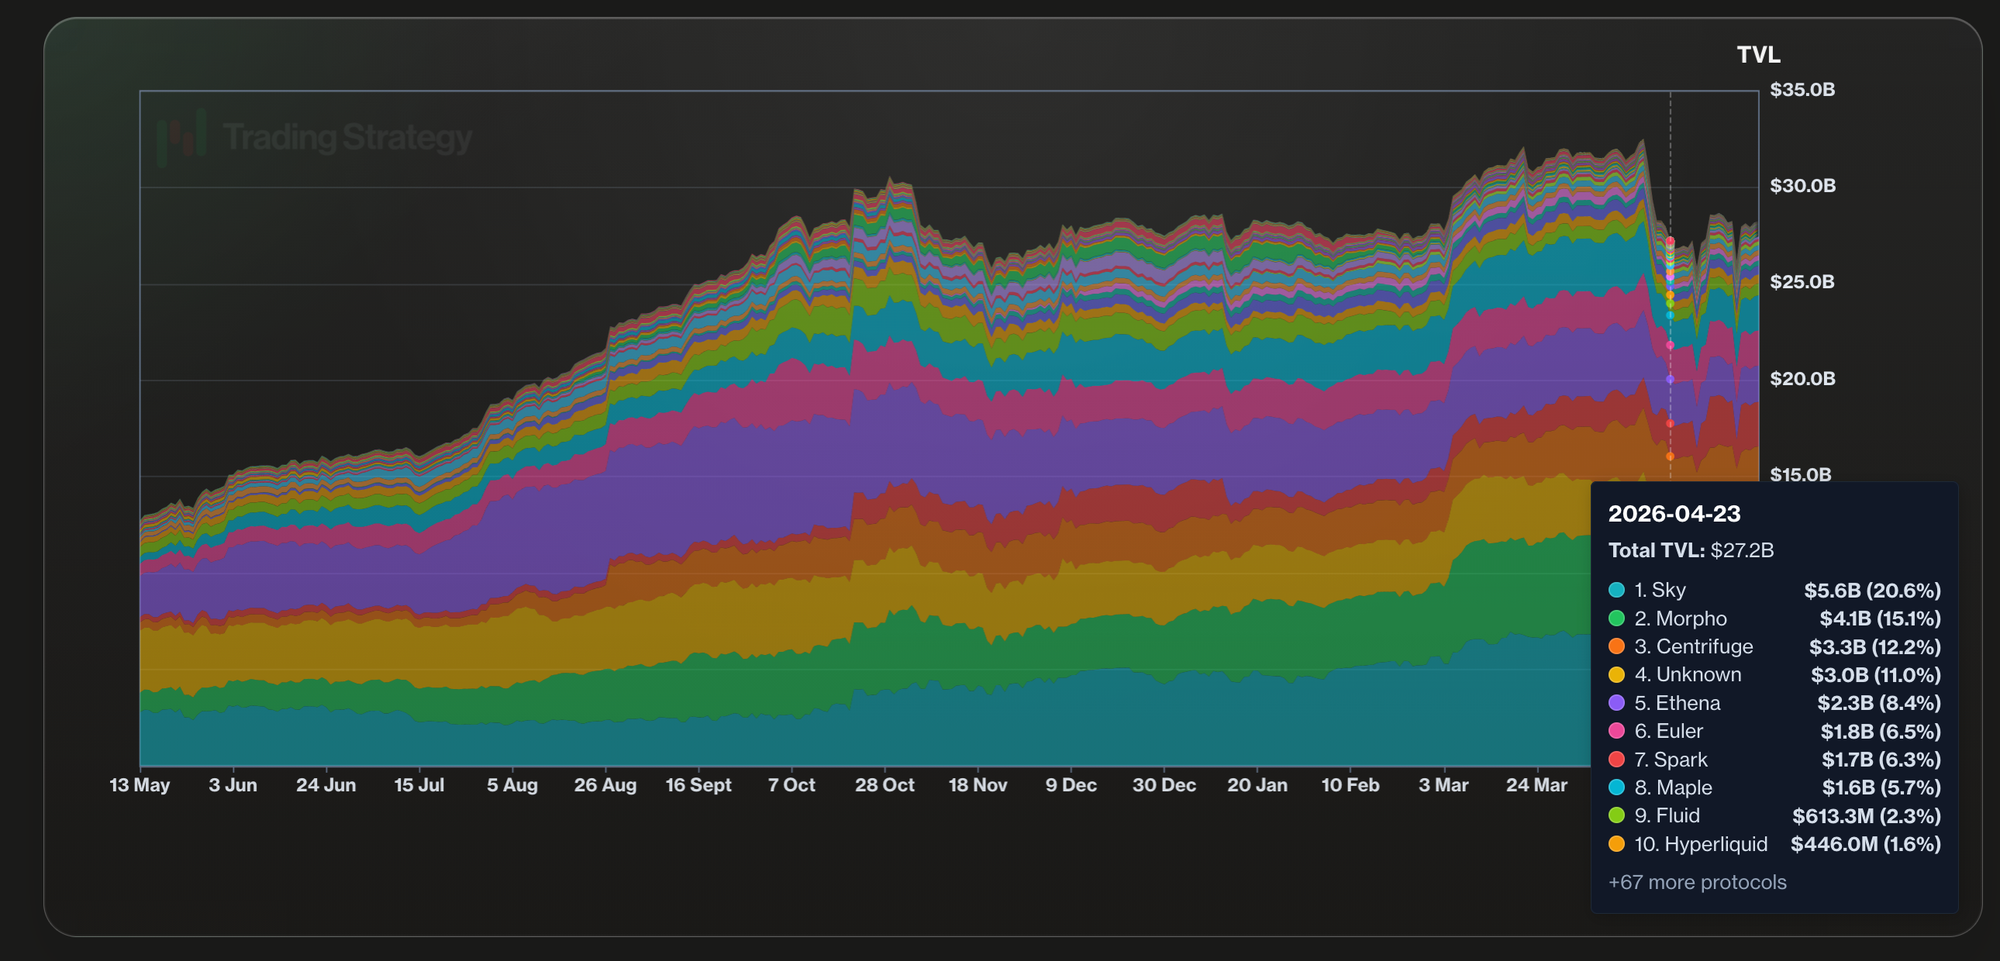
One of the killer applications of blockchains is vaults - automated investment strategies without middlemen. Despite rough market conditions, the stablecoin vault TVL has been steadily growing.
What is inside the dataset
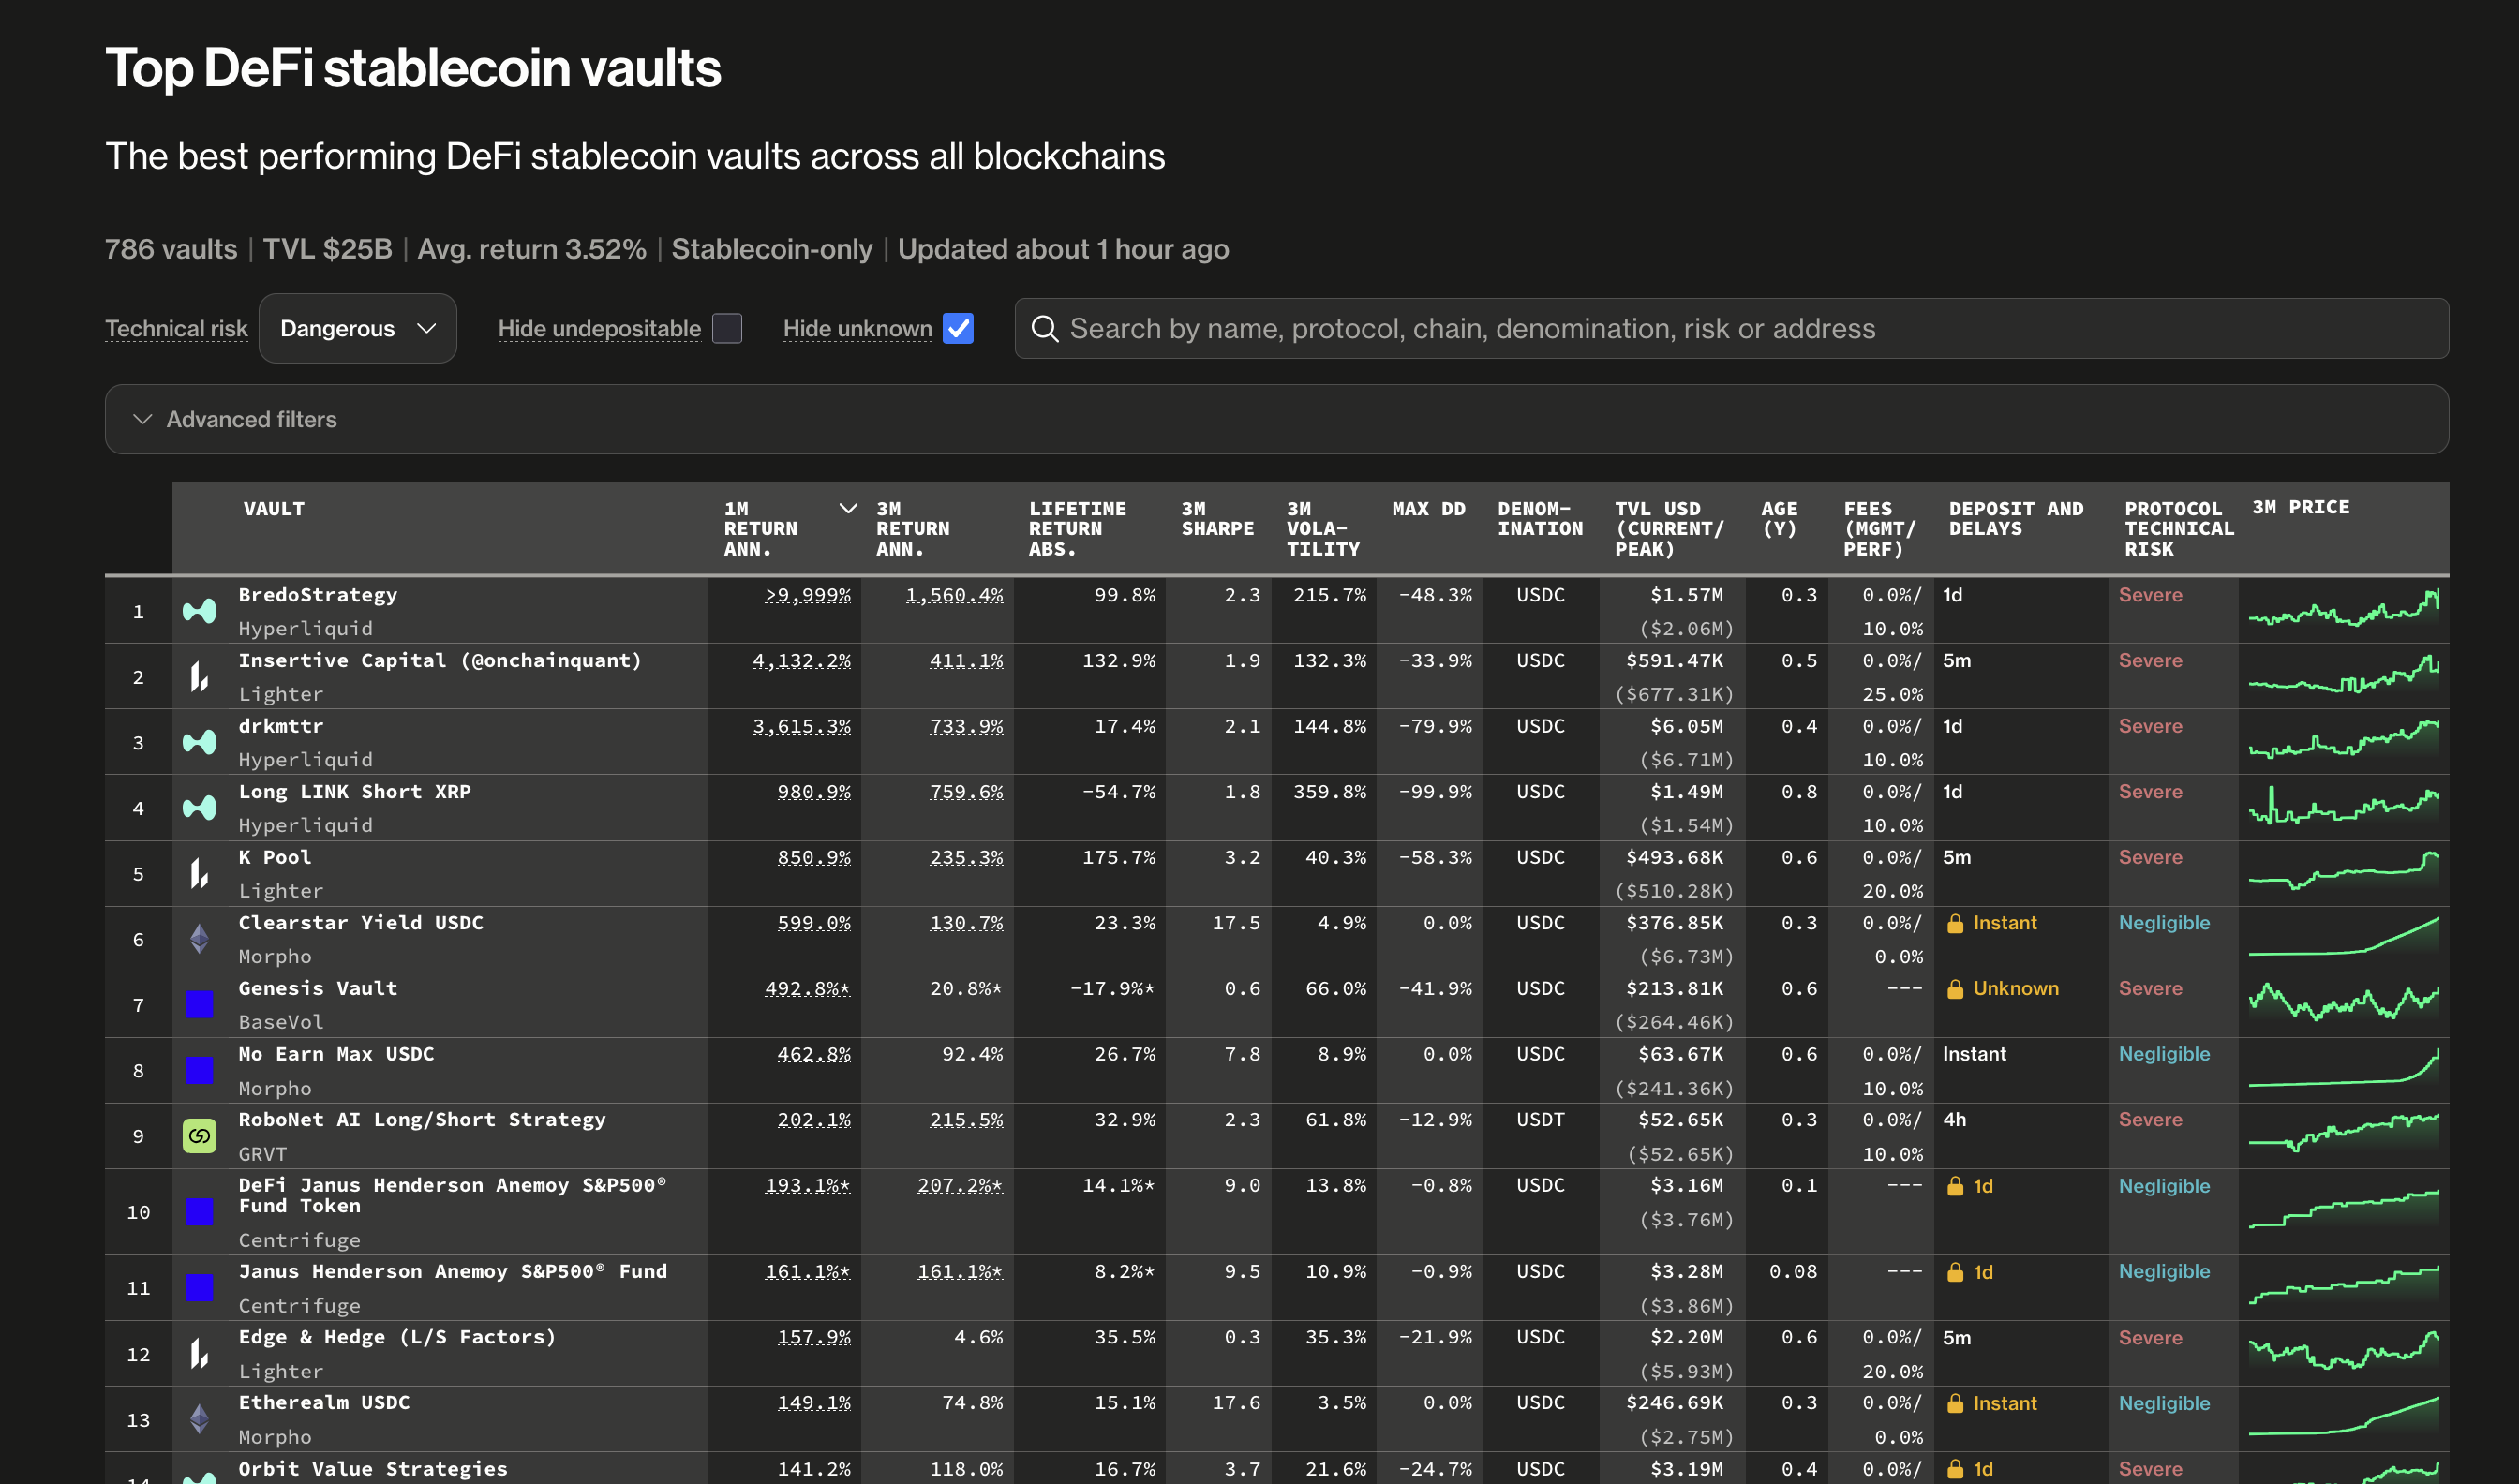
The Pro feed currently covers 25 blockchains, 80 vault protocols, and nearly 4,000 stablecoin vaults. The data is not limited to Ethereum and EVM chain lending vaults; it also includes perpetual futures trading vaults such as Hyperliquid, Grvt, Hibachi, and Lighter. For example, every stablecoin vault record is normalised so that a Morpho vault on Base can be measured against a Lagoon vault on Arbitrum without manual cleanup.
We track several metrics like
- Ranking
- Historical returns
- TVL
- Sharpe
- Technical and volatility risk
For qualitative features, we track
- Vault protocols
- Curators
- Chains
- Stablecoins
Why is this data different from anything else available?
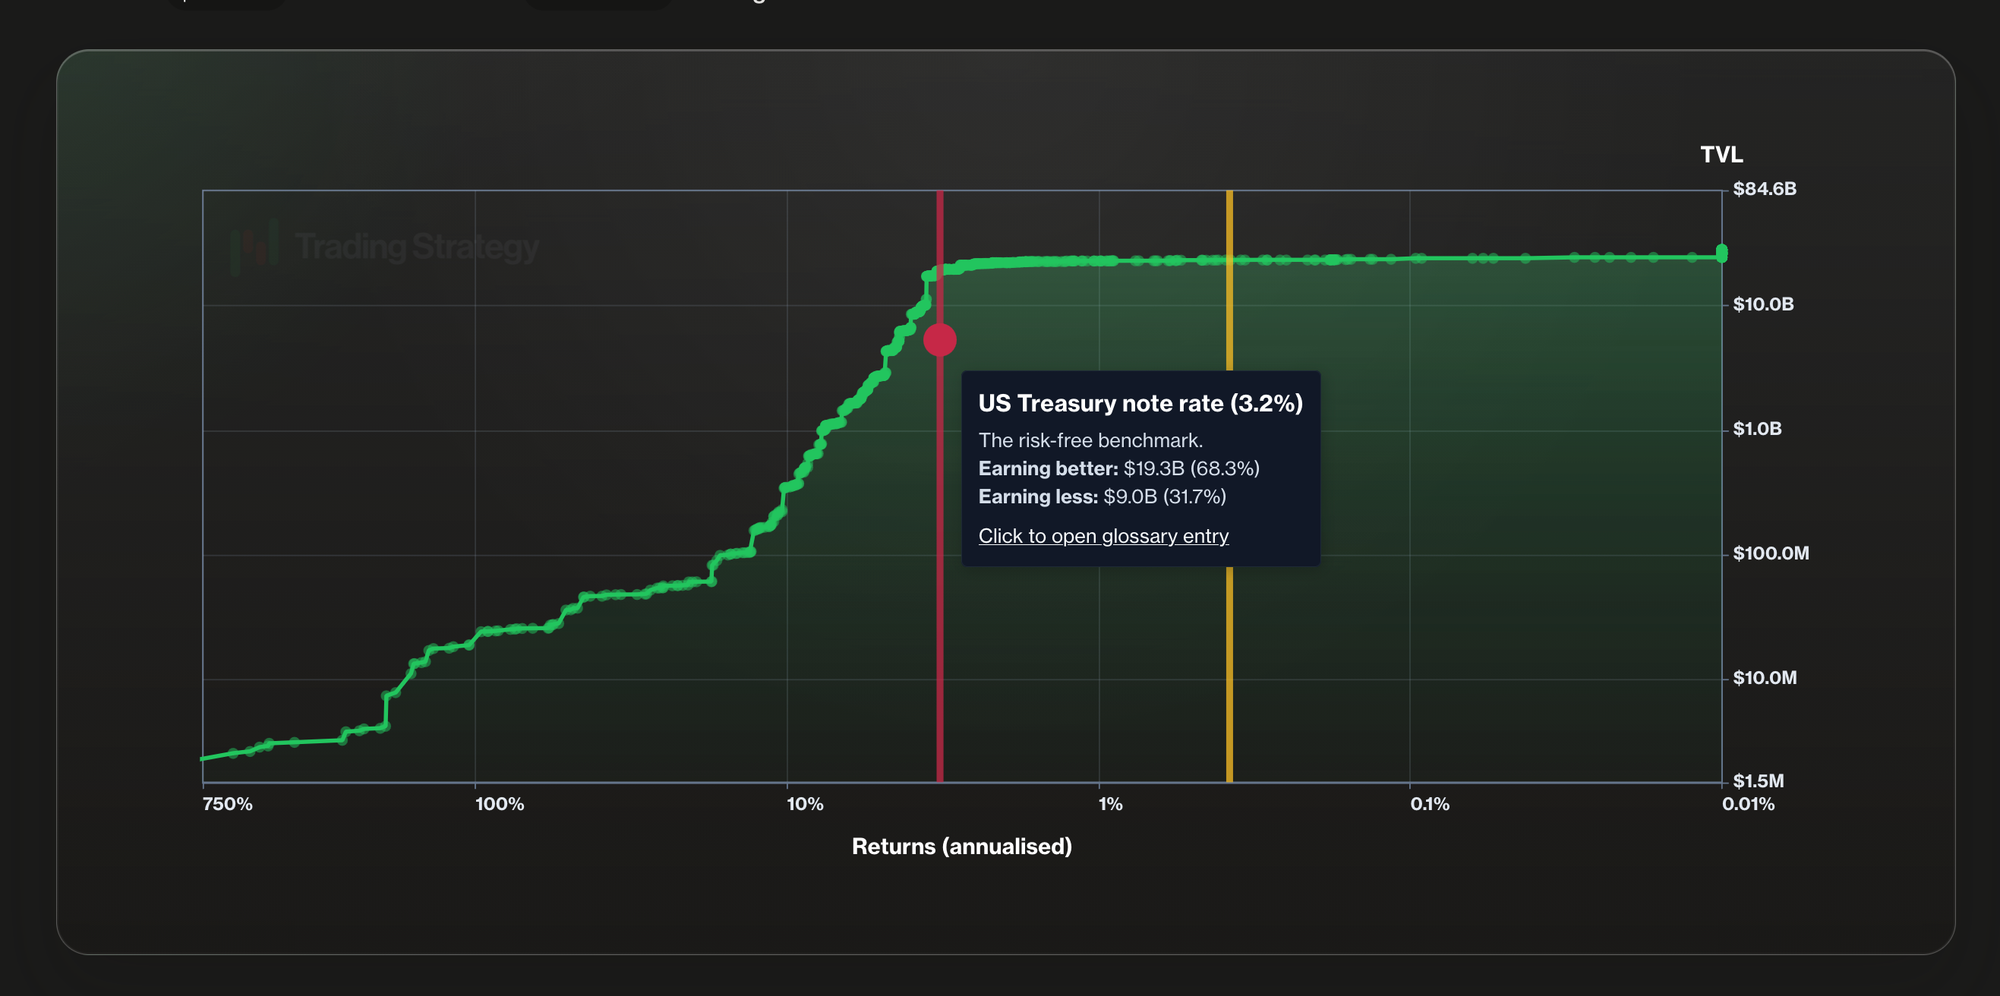
Most DeFi data services optimise for displaying numbers on a webpage. Trading Strategy data is built for the opposite use case: feeding portfolios, backtests, and trading systems. Returns are calculated net of fees, which may sound obvious until you compare them with the gross APY figures that dominate the rest of the industry. Risk is quantified through both market metrics, like Sharpe, and protocol-level technical risk scoring. The schema is consistent across all chains and protocols, so the same code that reads an Ethereum vault also reads a Hyperliquid one.
The data is also AI-ready. Files arrive in formats any agent can ingest directly. There is no scraping layer between the model and the truth.
Who benefits most from subscribing
- Quant developers and strategy builders finally get a backtestable, vault-aware universe in Python. The included Trading Strategy backtesting framework lets them prototype yield rotation, vault-of-vaults, and stablecoin strategies against years of clean history rather than weeks of patchy scrape jobs.
- DeFi-native funds and treasuries running allocator playbooks need defensible numbers when justifying positions. Net returns, Sharpe ratios, and technical risk categories give them the language LPs and boards already understand from traditional markets, applied to DeFi for the first time.
- Builders of AI investment agents want structured, machine-readable inputs covering the entire vault landscape. The dataset turns 25,000 individual smart contracts into one queryable surface that an agent can reason over without burning tokens on web scraping.
- Aggregators, dashboards, and protocol teams can power their own products with a single feed instead of integrating with 80 protocols individually.
For every group above, the alternative is to build the indexing, normalisation, and risk pipeline in-house, which takes engineering quarters rather than weeks.
Why subscribe already today
The vault market is one of the fastest-growing segments of DeFi, and the gap between informed and uninformed capital allocators is widening every week. Subscribing now means starting backtests against a dataset that already covers most of the relevant market. The Pro tier is what most serious users settle into once they realise how much time the normalised history saves.
Startup discounts are available.
You can review the full feature comparison at the pricing page and start exploring the data fields at the documentation.