Trading Strategy created a new kind of liquidity chart that makes it easy to understand liquidity formation on decentralised exchanges.
Why is liquidity important?
Liquidity tells how much exchange carries inventory for making a trade.
Liquidity is directly related to the price impact and subsequently the fees of your trade. Price impact is the difference between the current market price and the price you will actually pay when performing a swap on a decentralized exchange.
- Investors want liquidity so they can enter and exit positions cheaper
- Illiquid trading pairs pose a risk that it is difficult to unwind or take large positions
- Good liquidity is needed for a token to make it a good collateral on lending services and thus also enable future markets, like shorting
Understanding liquidity is important for
- Trade execution: you don't end up paying too high fees
- Risk management: taking positions on illiquid tokens is riskier than on liquid ones
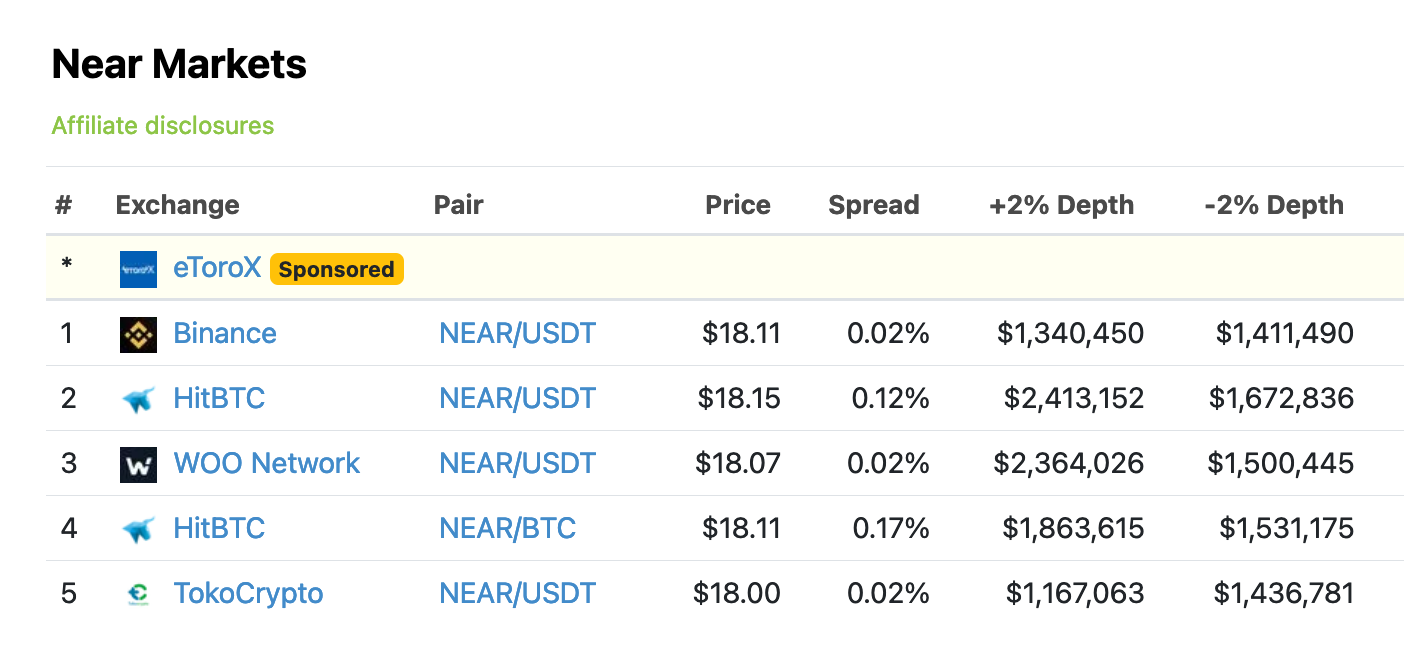
On XY=K bonding curve automated market maker exchanges the amount of liquidity directly tells what the price impact will be. This is unlike for order book based exchanges where liquidity is usually expressed as the price impact at certain order book depths. For example, Coingecko is showing 2% depth impact.
Introducing liquidity OHLC charts
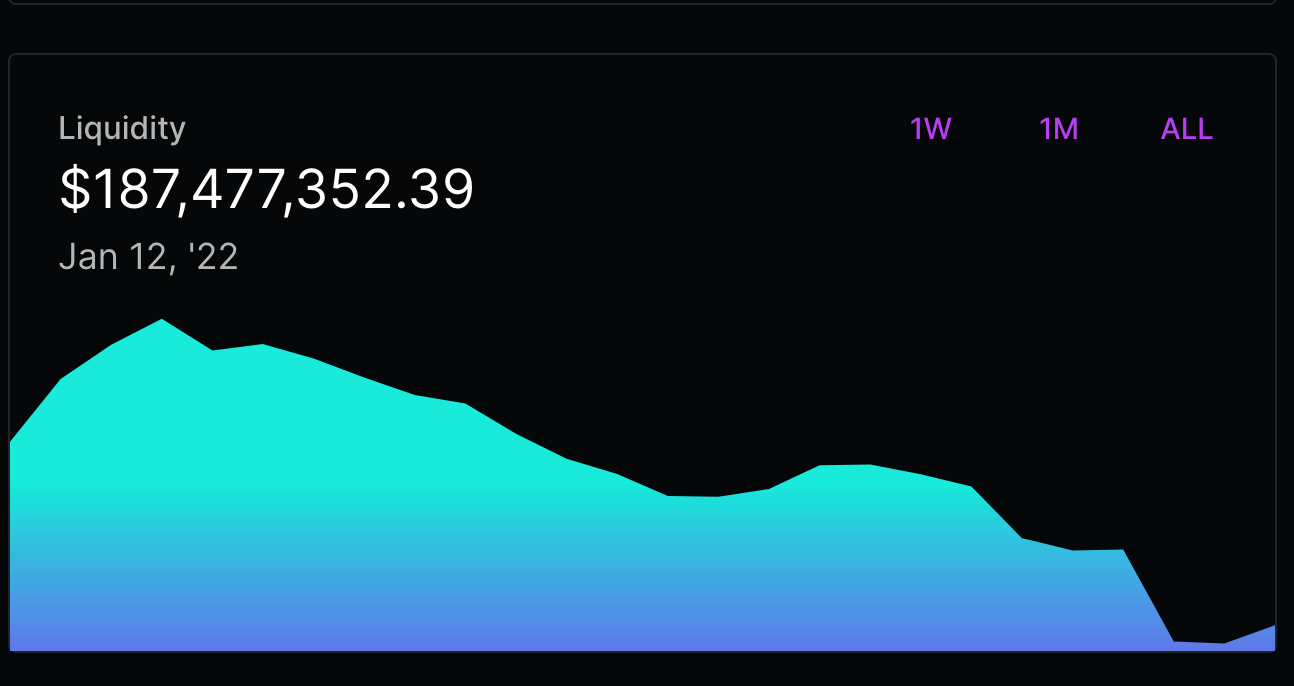
While liquidity charts for decentralised exchanges exist e.g. by the exchanges themselves, these are not sophisticated enough for most professional investment purposes. You usually get only the price impact at the time of the trade and a rough liquidity view over time.
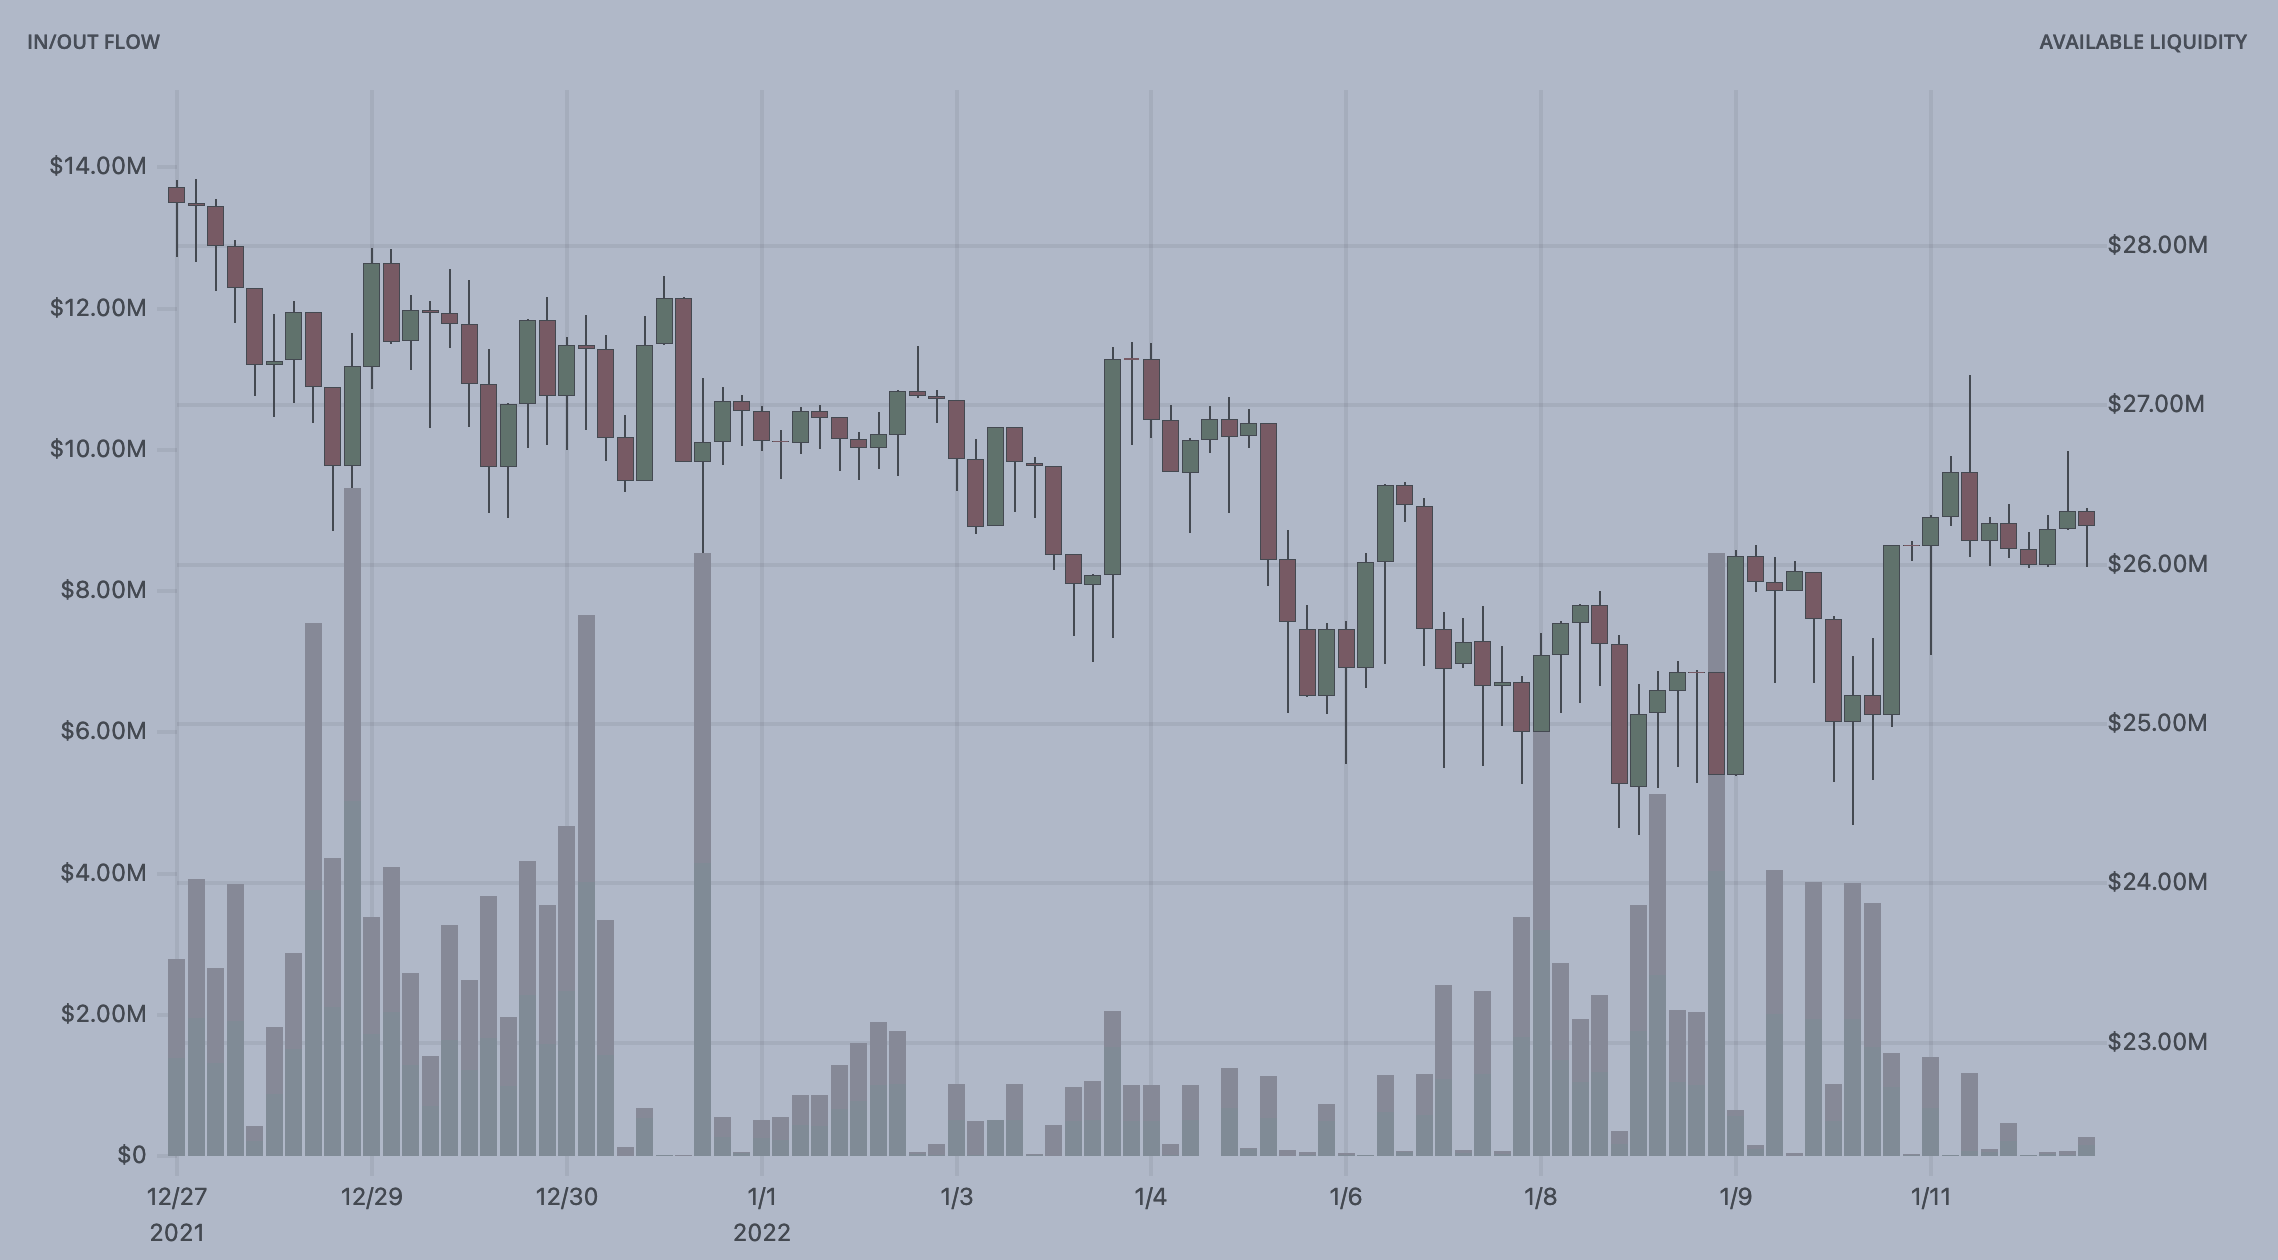
Here at Trading Strategy we have come up with a new way of expressing the liquidity development, based on the popular OHLCV candle chart format that expresses price and volume action. We call this OHLC liquidity chart.
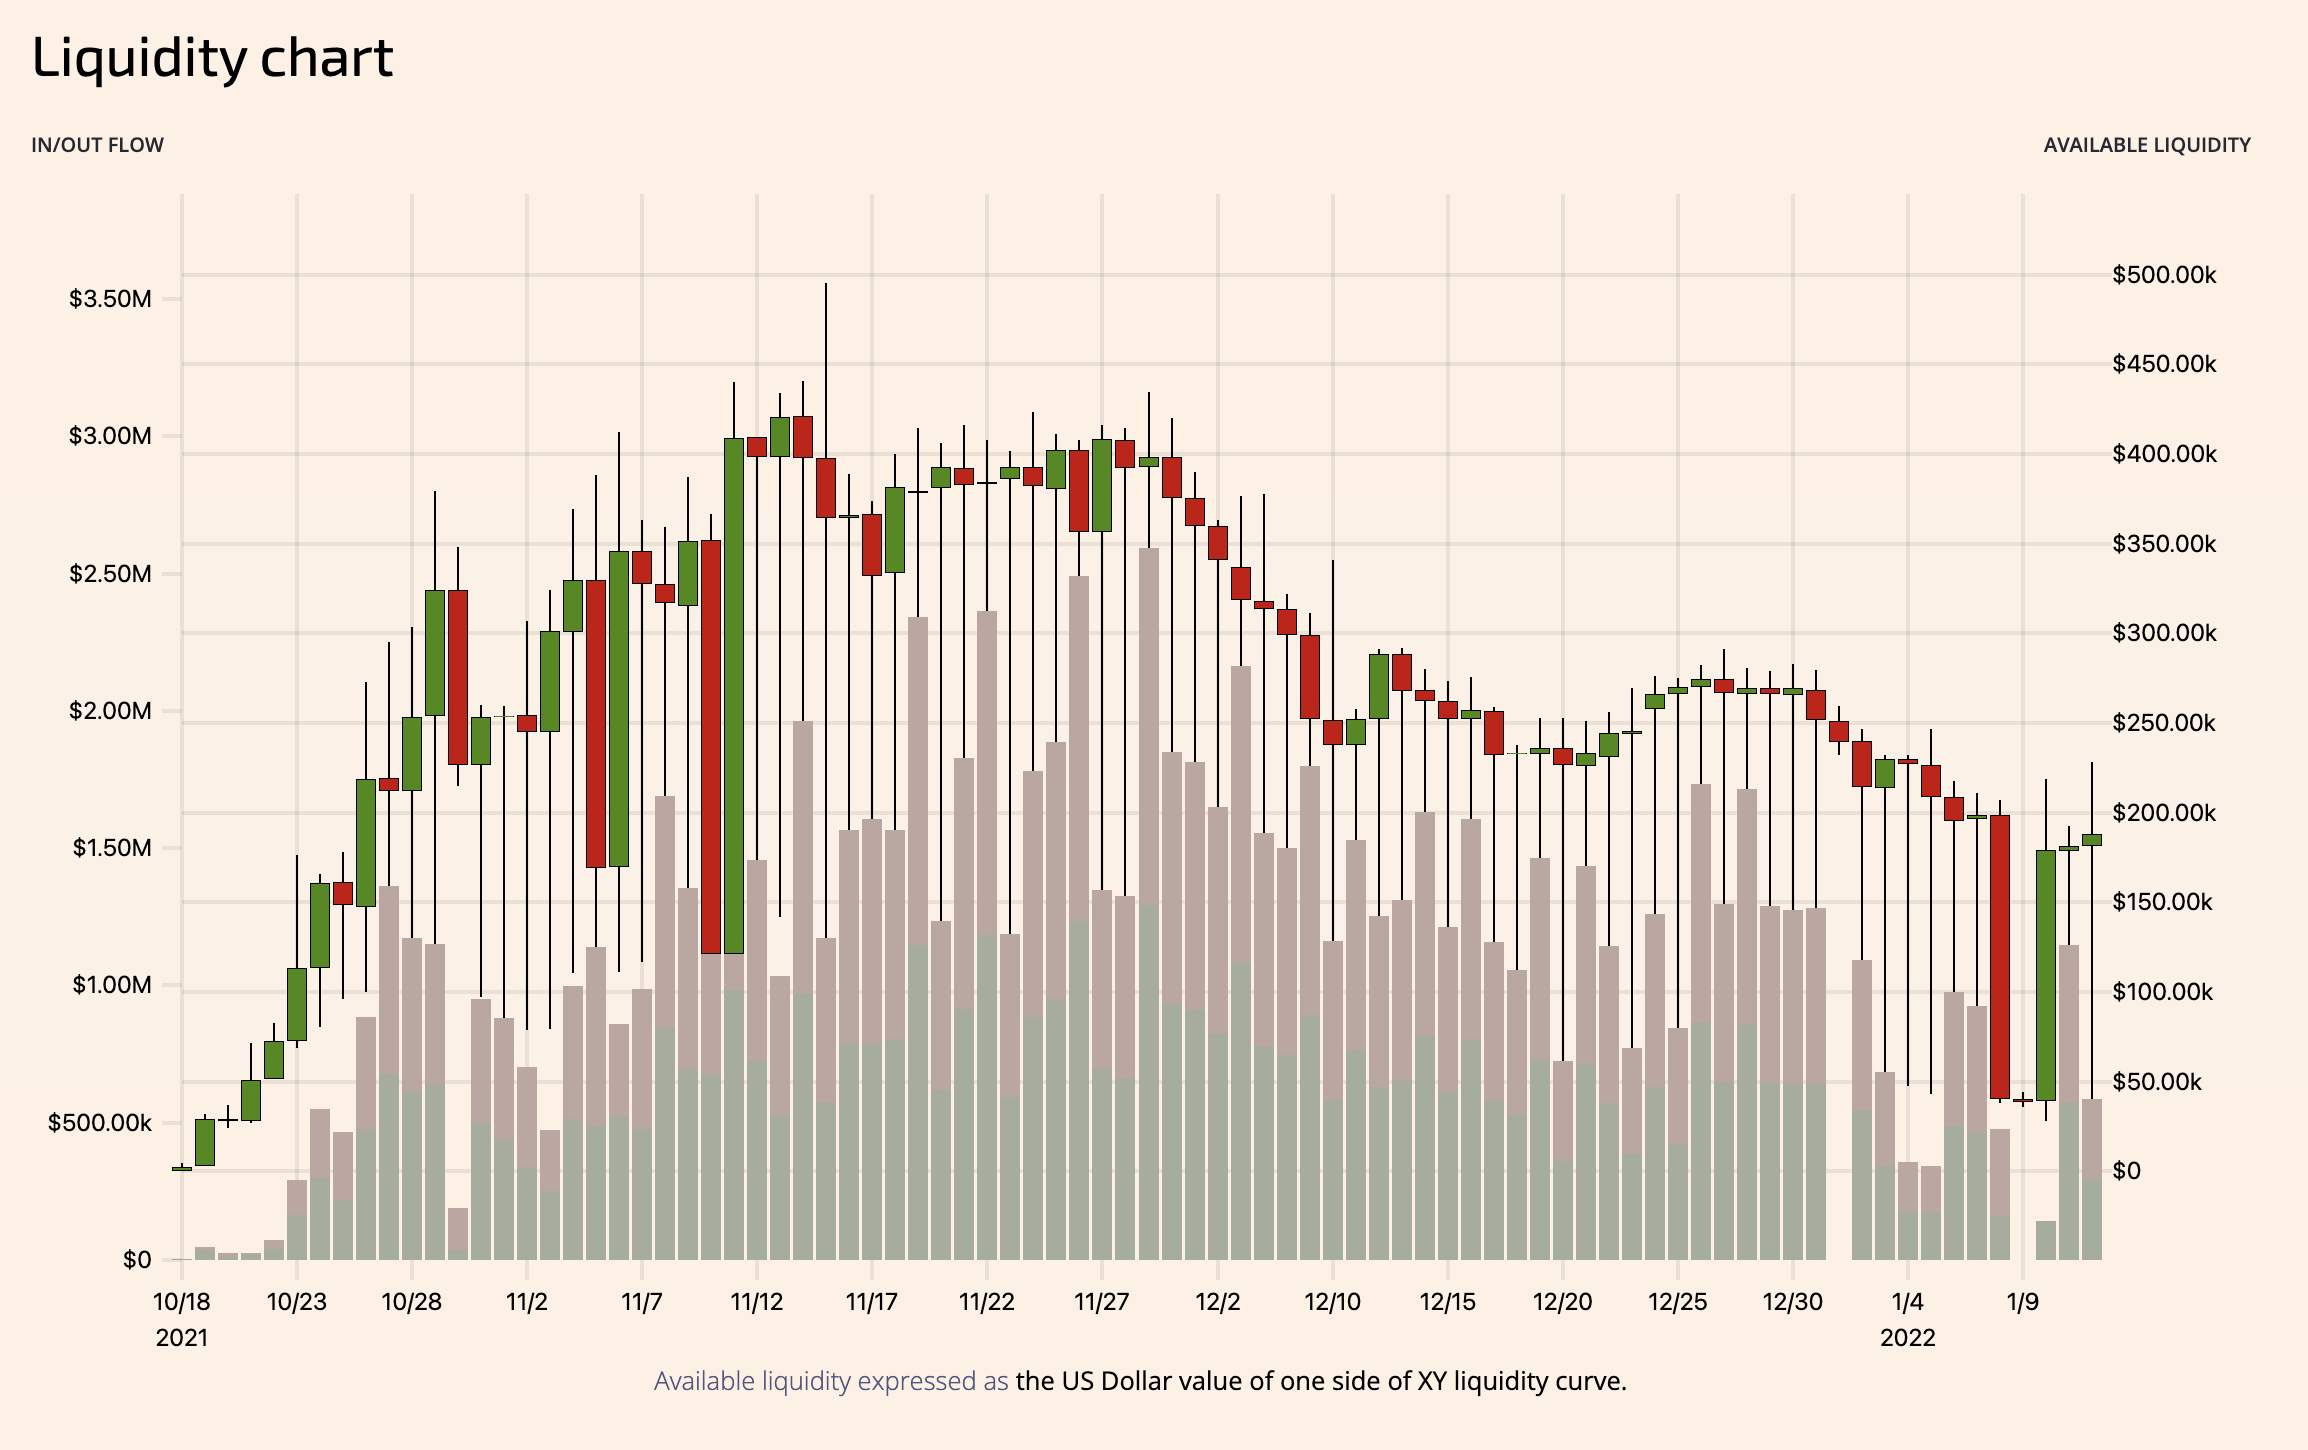
Like its price action sibling, the OHLC liquidity chart shows liquidity open, high, low and close values at a certain time frame, also known as a candle. Green candles are our favourite, they express liquidity going up, while red candles tell that the closing liquidity was lower than opening liquidity.
We also show two liquidity flow-related stacked bars at the bottom of the chart. One shows liquidity inflow, or added liquidity in AMM vocabulary, and red bars that show the amount of removed liquidity, the outflow. This is important as in AMM the actions of adding and removing liquidity are separate from buying and selling. The liquidity amount can fluctuate due to exchange rate changes, but these bars show the actual added and removed liquidity actions by the market participants.
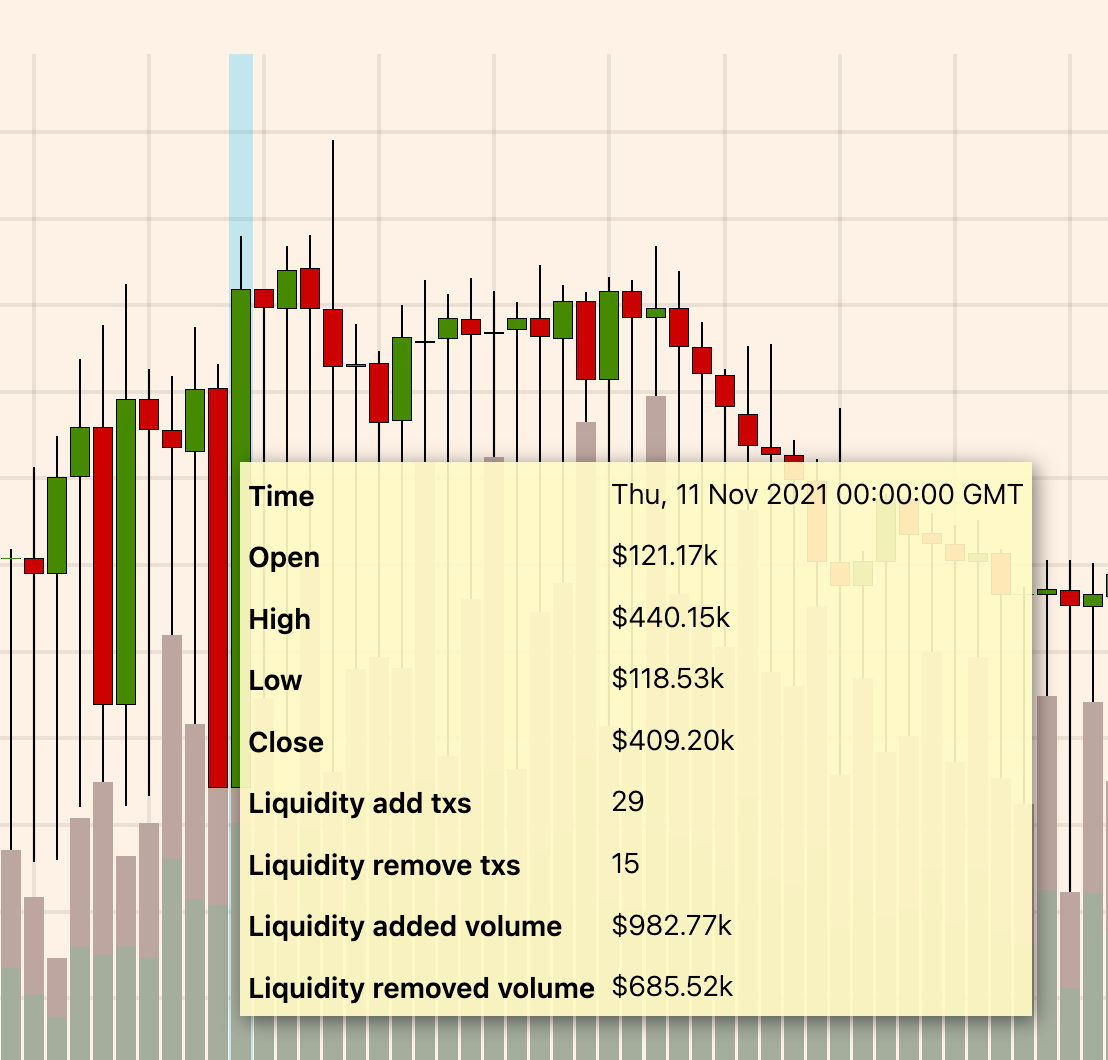
We also provide a detailed analysis showing the actual numbers on a liquidity candle mouse hover. This shows individual adds and removes that took place on the exchange, so you get a feeling of what kind of market participants there are: one liquidity provider whale with a single action or multiple small retail market participants.
Unlike other decentralised exchange market data services, Trading Strategy converts all trading amounts to US dollars to make the market analysis easier.
Researching the liquidity formation
While a large existing body of knowledge exists for OHLCV trading signals and analysis, we believe that AMM liquidity analysis will become crucial for advanced decentralised finance focused trading strategies. Not only because of the price impact estimation but understanding how the liquidity is formed over a period of time. The pattern of liquidity formation shows signals if the token price action is long term sustainable, or the risk impact of short term downturns.
Liquidity API
All Trading Strategy software development is API first. Hence, our liquidity API is immediately available, in both real-time API and for historical backtesting datasets.
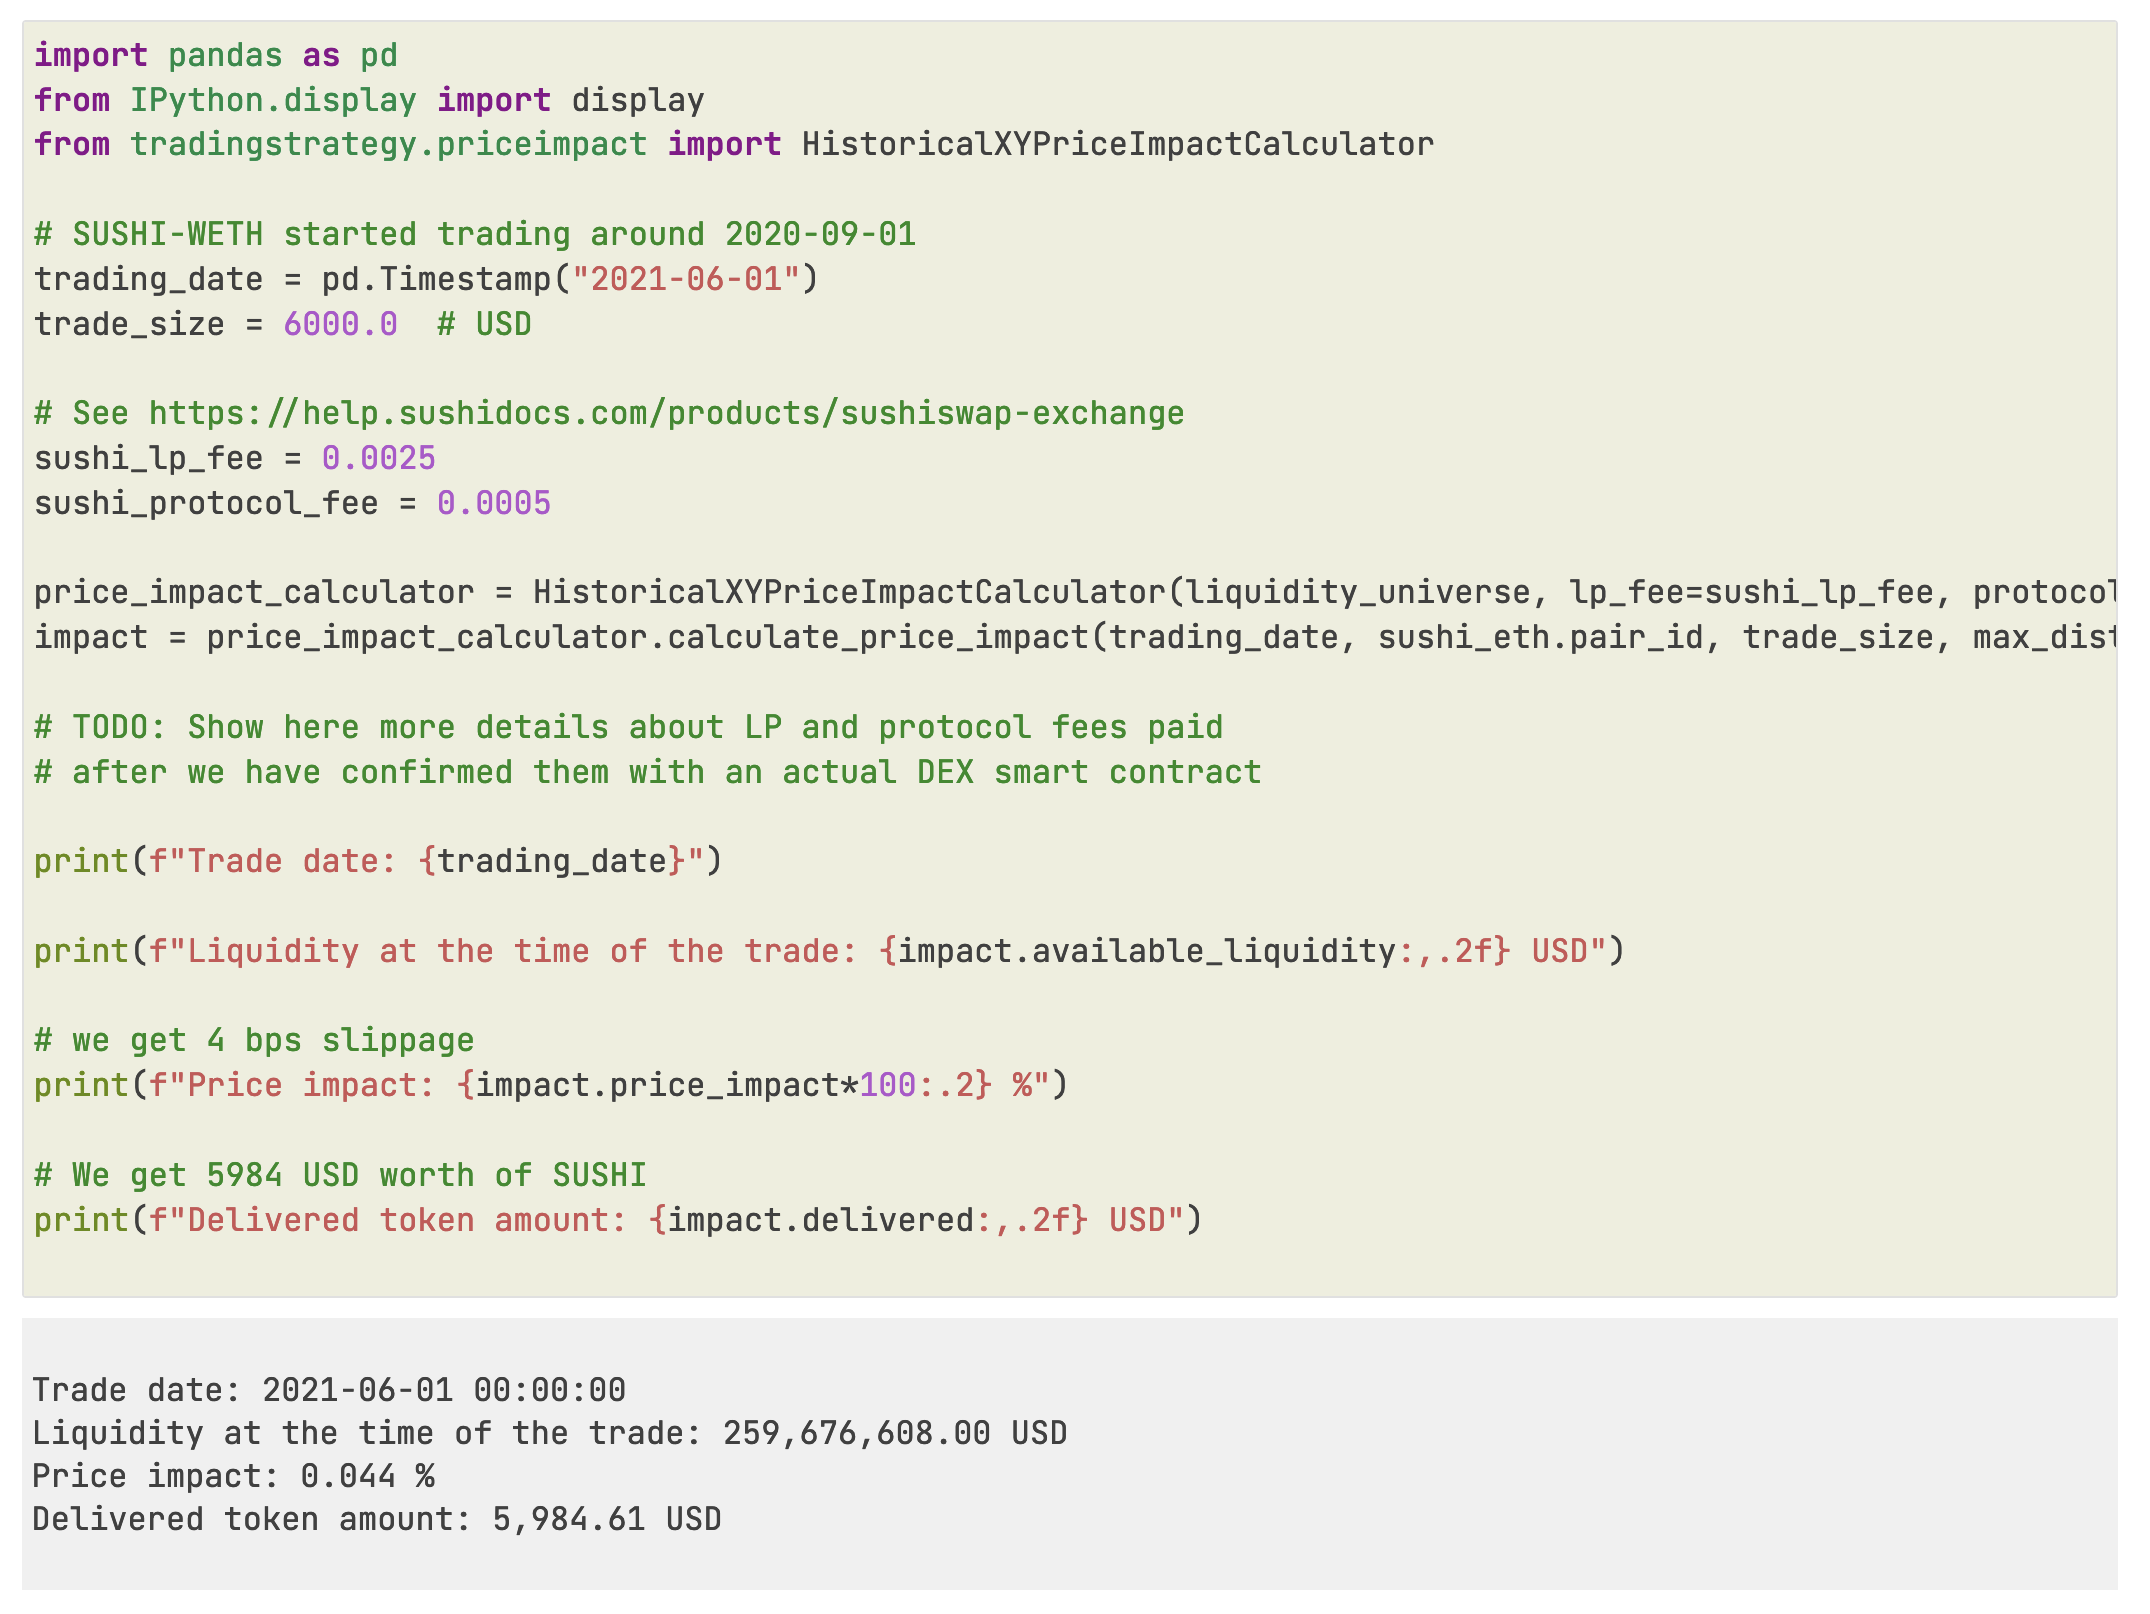
We have published an example Jupyter Notebook for the price impact analysis in our documentation for the Trading Strategy Python client.
Future work
Currently, Trading Strategy only supports xy=k bonding curve models for liquidity analysis. This is going to be expanded for ranged liquidity models that Uniswap v3 and Sushiswap v3 exchanges are providing.
We are hiring
We are currently hiring for frontend (Svelte), backend (Python/PostgreSQL) and quant research (Jupytere Notebook/Pandas) positions. If you are interested in working with cryptocurrencies and algorithmic trading please email us at: [email protected]
Trading Strategy is an algorithmic trading protocol for decentralised markets, enabling automated trading on decentralised exchanges (DEXs). Learn more about algorithmic trading here.
Join our community of traders and developers on Discord.