In the dynamic world of trading, understanding the performance of a trading strategy is crucial. Enter the equity curve chart—a powerful visualisation tool that not only reveals the trajectory of a portfolio but also provides invaluable insights into its relationship with the market. We explore the significance of equity curve charts and how they can revolutionise your trading endeavours.
What is an equity curve chart?
An equity curve chart is a graphical representation of a trading portfolio's performance over a specific time period. It displays the value of the portfolio over time, typically using a line graph. The chart includes two lines: one representing the performance of a buy-and-hold strategy, reflecting the market's performance, and the other representing the portfolio's performance when following a specific trading strategy. Traders can compare these lines to assess the strategy's performance relative to the market. Equity curve charts offer valuable insights into profitability, drawdowns, and potential risks, helping traders make informed decisions about their strategies, risk management, and portfolio allocation.
How to use equity curve charts
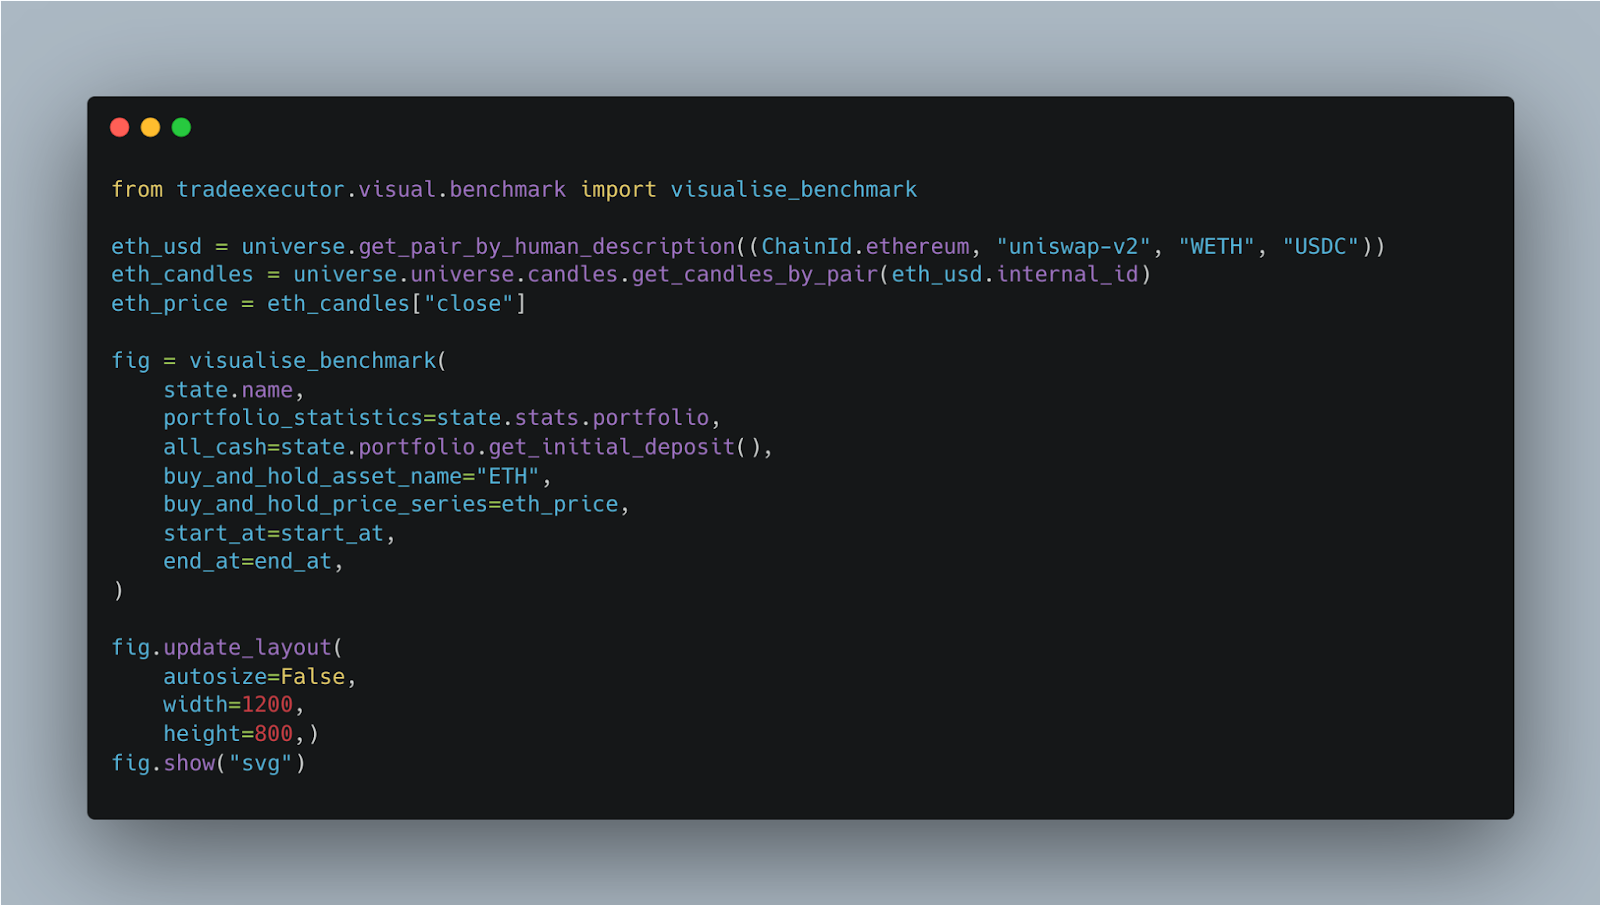
To generate an equity curve chart, the `visualise_benchmark` function in the codebase is used. The chart will display two lines: a red line representing the value of a portfolio that simply bought and held a particular asset for the entire trading period, and a green line representing the value of the portfolio following the trading strategy.
E.g. The following code, found in this strategy, outputs the corresponding equity curve
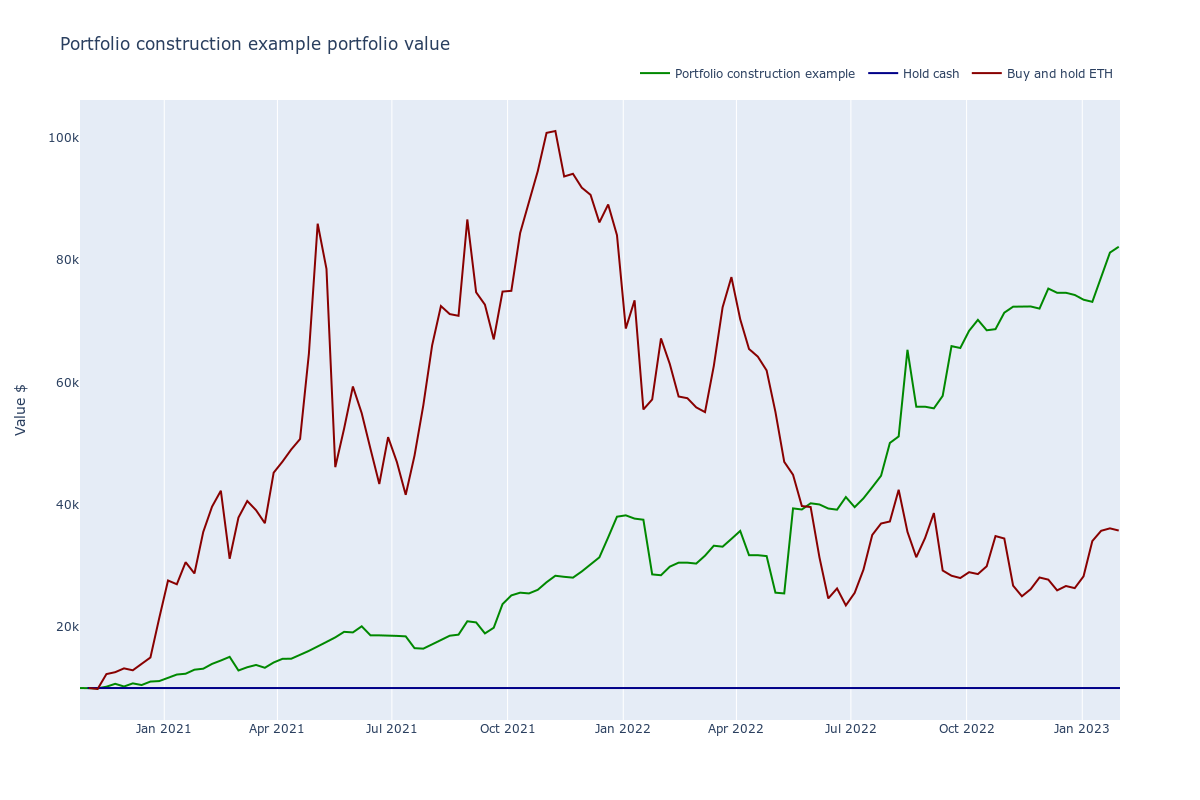
The importance of understanding not only the equity curve itself but also its relation to the market is emphasised. In this example, the red line serves as a proxy for the market, as Ethereum has the second-highest market cap of all cryptocurrencies and closely follows Bitcoin. By analysing the chart, it is found that the strategy generates profits during both bullish and bearish periods. From the start of the strategy to November 2021, the green line trends upwards but does not outperform the red line. However, when the market trends downwards, the strategy continues to generate profits as the green line maintains its upward trajectory.
Why you should use equity curve charts
- Performance evaluation: They provide a visual representation of portfolio performance, allowing you to assess profitability, drawdowns, and risk.
- Risk assessment: They help identify periods of high risk and market volatility, enabling effective risk management.
- Strategy improvement: Analysing equity curves reveals patterns and trends, aiding in refining and optimising trading strategies.
- Market insights: By comparing the portfolio's performance to a market benchmark, you can understand how the strategy performs relative to the market.
- Trader confidence: Equity curve charts enhance credibility and instil confidence when analysing portfolio performance
Final thoughts
Equity curve charts serve as powerful tools in the world of trading, they help us understand and evaluate portfolio performance. These charts visually represent the trajectory of a portfolio and its relationship with the market, providing invaluable insights. By assessing profitability, risk, and drawdowns, equity curve charts allow traders to make informed decisions about their strategies, manage risk effectively, and refine their approaches. By comparing the portfolio's performance to a market benchmark, traders gain market insights and can build confidence in their over trading strategy. Incorporating equity curve charts into your analysis is essential for optimising performance, managing risk, and achieving success in the dynamic world of trading.