
Earlier this month we hosted an algorithmic trading workshop at Avalanche Summit II in Barcelona. CEO & Co-founder, Mikko Ohtamaa shared how to convert your TradingView-based algorithm into DeFi.
There are plenty of options for algorithmic trading for TradFi and centralised markets, however many people have attempted to leverage this type of trading for DeFi, but typically run into highly complex issues or lack of sophisticated technology available to achieve this. We take a deep dive into how this can now be achieved and demonstrate examples of fully functioning trading strategies on decentralised markets.
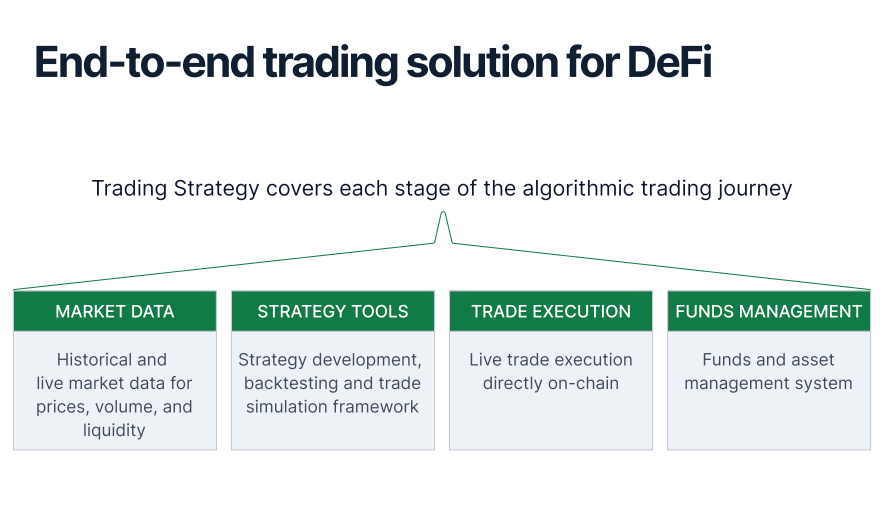
Bringing your professional trading tool to DeFi
The idea of Trading Strategy is to have the same level of access to advanced-level algorithmic trading tools found in TradFi, for decentralised markets. Currently, tools such as TradingView, Bloomberg and MetaTrader are not available and are well equipped to handle DeFi, which means there is a large gap in the market for DeFi algorithmic trading. However, we have created a solution where all of this can be achieved through Trading Strategy as an end-to-end algorithmic trading solution.
From TradingView’s PineScript into Python
Many people are familiar with TradingView’s coding language PineScript, where you are able to create backtests and custom indicators. We have created a simple example strategy where we use it to demonstrate exactly how to convert a PineScript strategy into Python that can be used for DeFi trading.
Example strategy
The example strategy is a simple Bollinger band strategy. Whether it makes profit or not is outside the scope of the example. The strategy is not optimised at all and parameters are picked more or less by a gut feeling. Please use this example as learning material and base for your own strategies.
- Use Bollinger Band's and RSI to determine position entries
- Long only - suitable for DEX spot markets like Trader Joe
- 4 hours timeframe for candles
- Backtesting period of 2024-04-01 - 2023-04-01
- Use a tight stop loss when entering a position
- This will result multiple positions closed for stop loss and few profitable positions during market rallies
- We target the following live trading pairs
- EAVAXTH/USDC pair on Trader Joe on Avalanche with 20 BPS fee tier. See a note about this in decide_trades() Python code.
- Coinbase ETH/USDC with 60 BPS market taker fee (12x more expensive than DeFi)
Note: Long only strategies are challenging in a descending or sideways cryptocurrencies market like 2021-2023. Furthermore, this strategy was handpicked for an overly short backtesting period, to better illustrate the features of the backtesting framework.
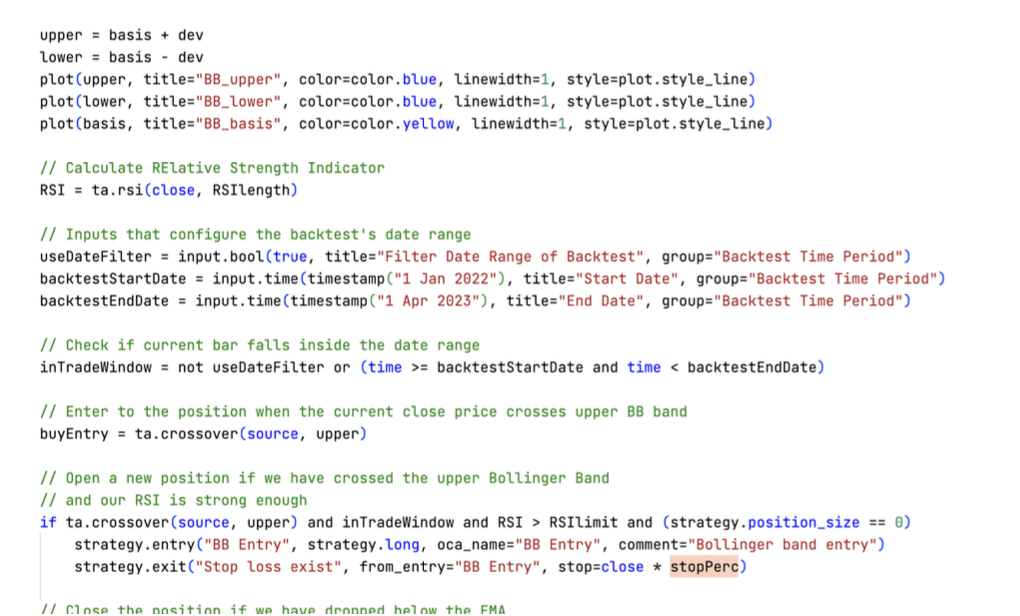
PineScript strategy example
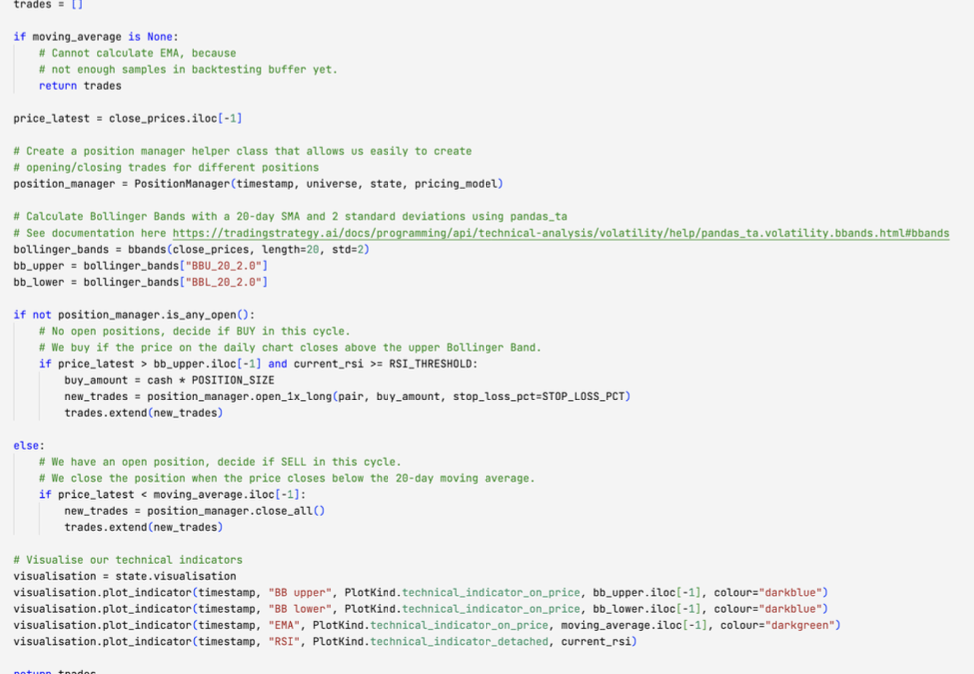
Python strategy example
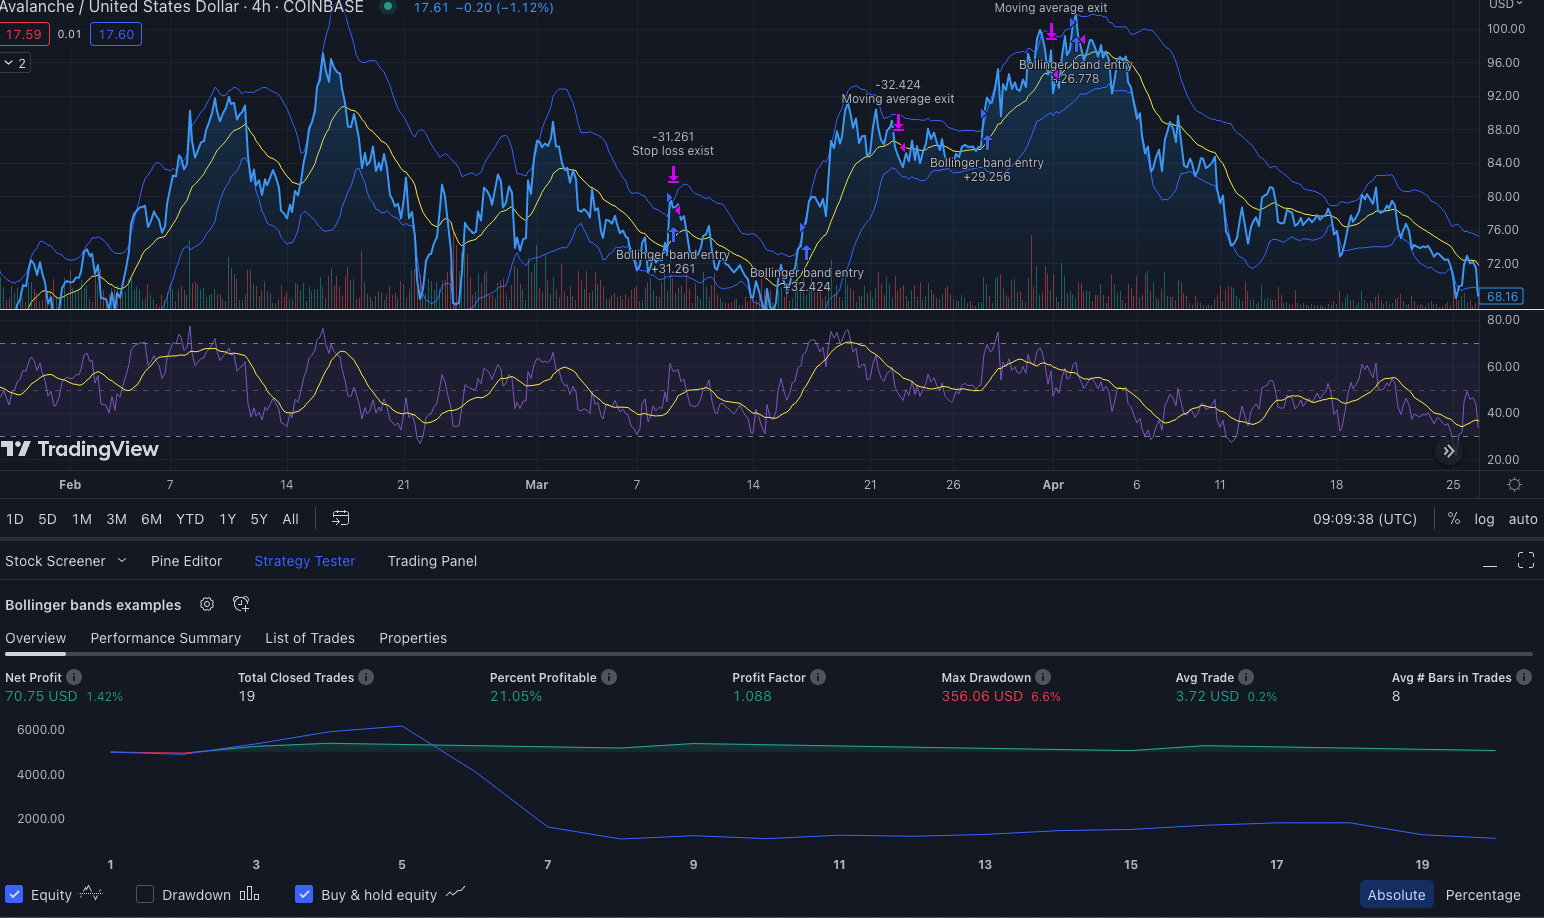
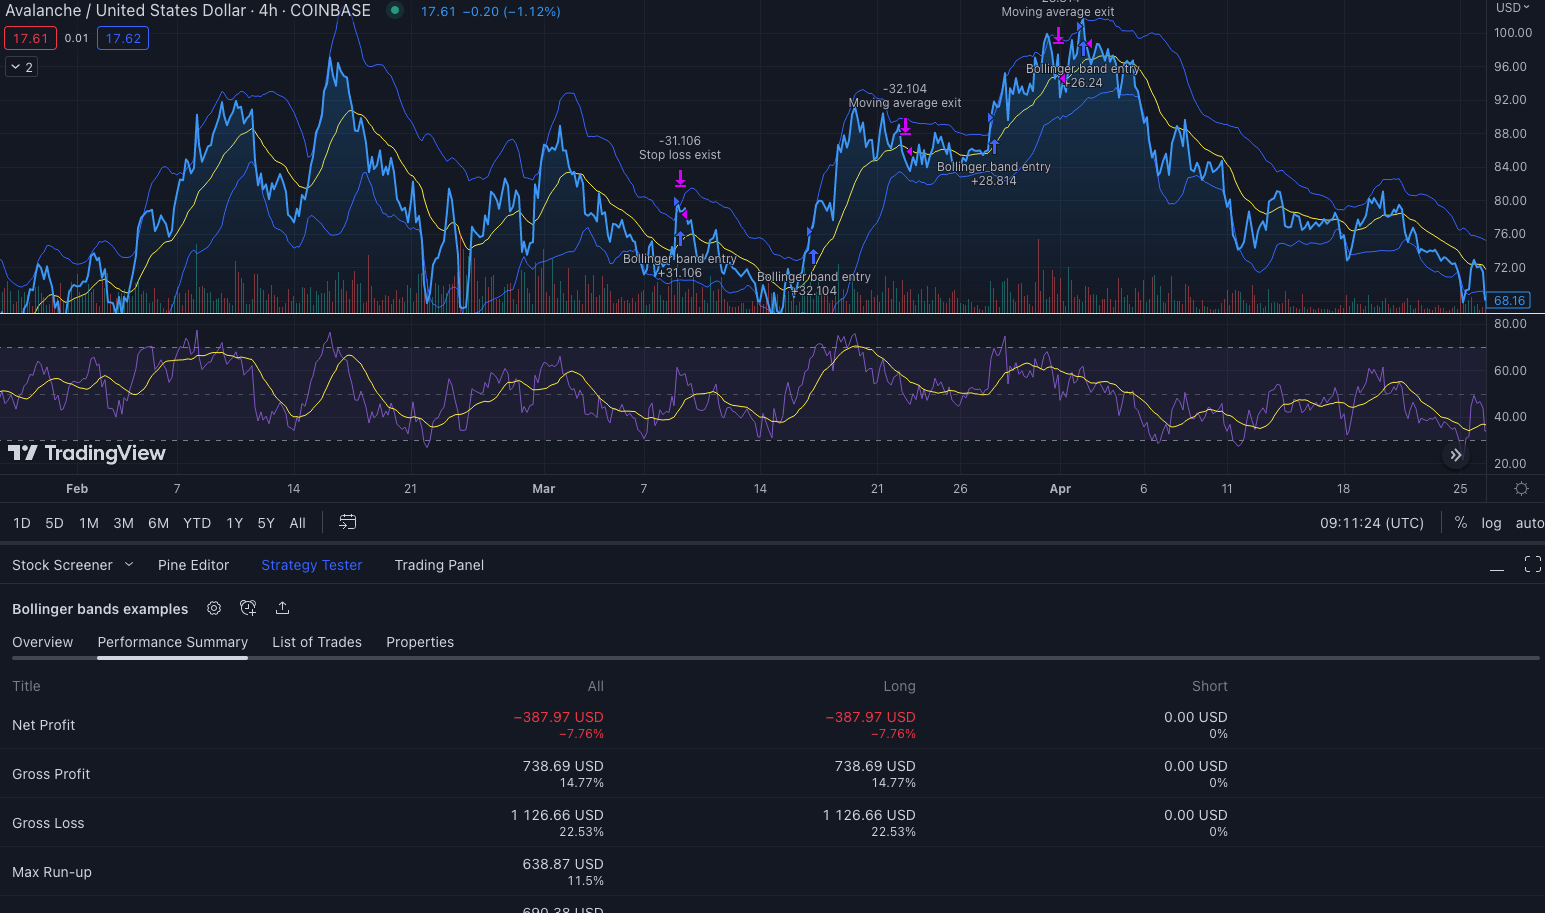
Performance analysis: TradingView vs DeFi
Both TradingView and Trading Strategy strategies open positions in a similar fashion, so they are more or less comparable.
Note. Because of the different price feeds and other subtle differences you cannot have the same strategy backtest result on two different markets: Coinbase and Trader Joe.**. If you carefully examine the price chart, RSI and other indicators, you will see the results vary a bit. In such a small backtesting timeframe, this strategy is prone to small fluxuations and is not robust. The goal of this example, however, is not robustness, but easily demonstrable data.
If you examine, some of positions like ~March 17th are opened around the same time, so we do see that the strategy is following the same pattern.
Both strategy implementations make a low number of trades, 10-20, for the backtesting period. This makes it easier to demonstrate the example.
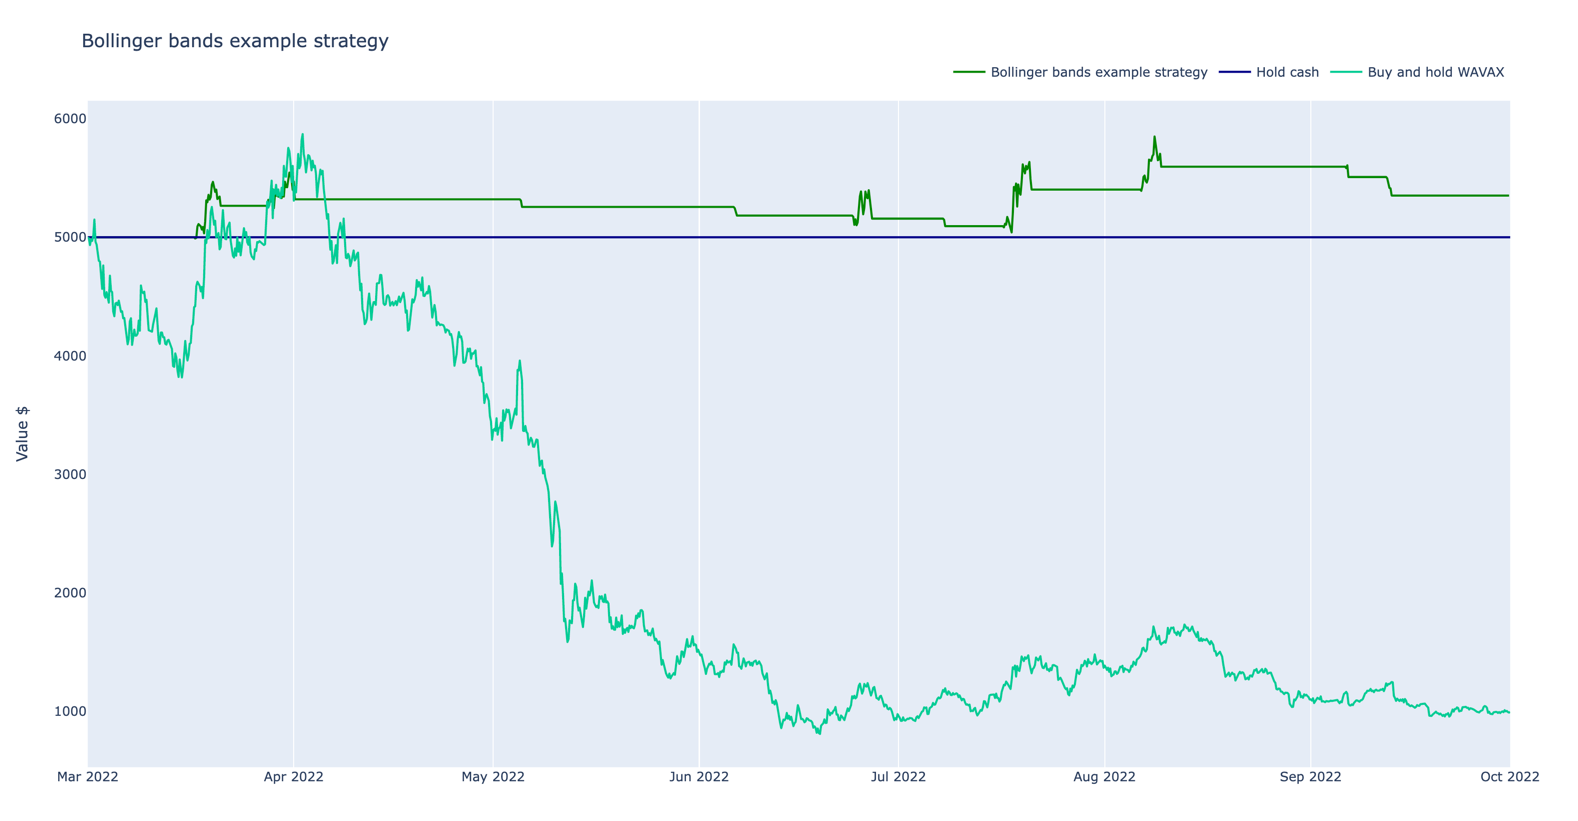
Equity curve
How well the strategy would have historically performed on AVAX-USDC pair on Trader Joe on Avalanche (20 BPS fee).
How well the strategy would have historically performed on AVAX-USD on Coinbase (no fees).
However, if we switch on 50 BPS taker fee on Coinbase we can see it destroys the strategy performance, going to loss (vs. 20 BPS fee on Trader Joe).
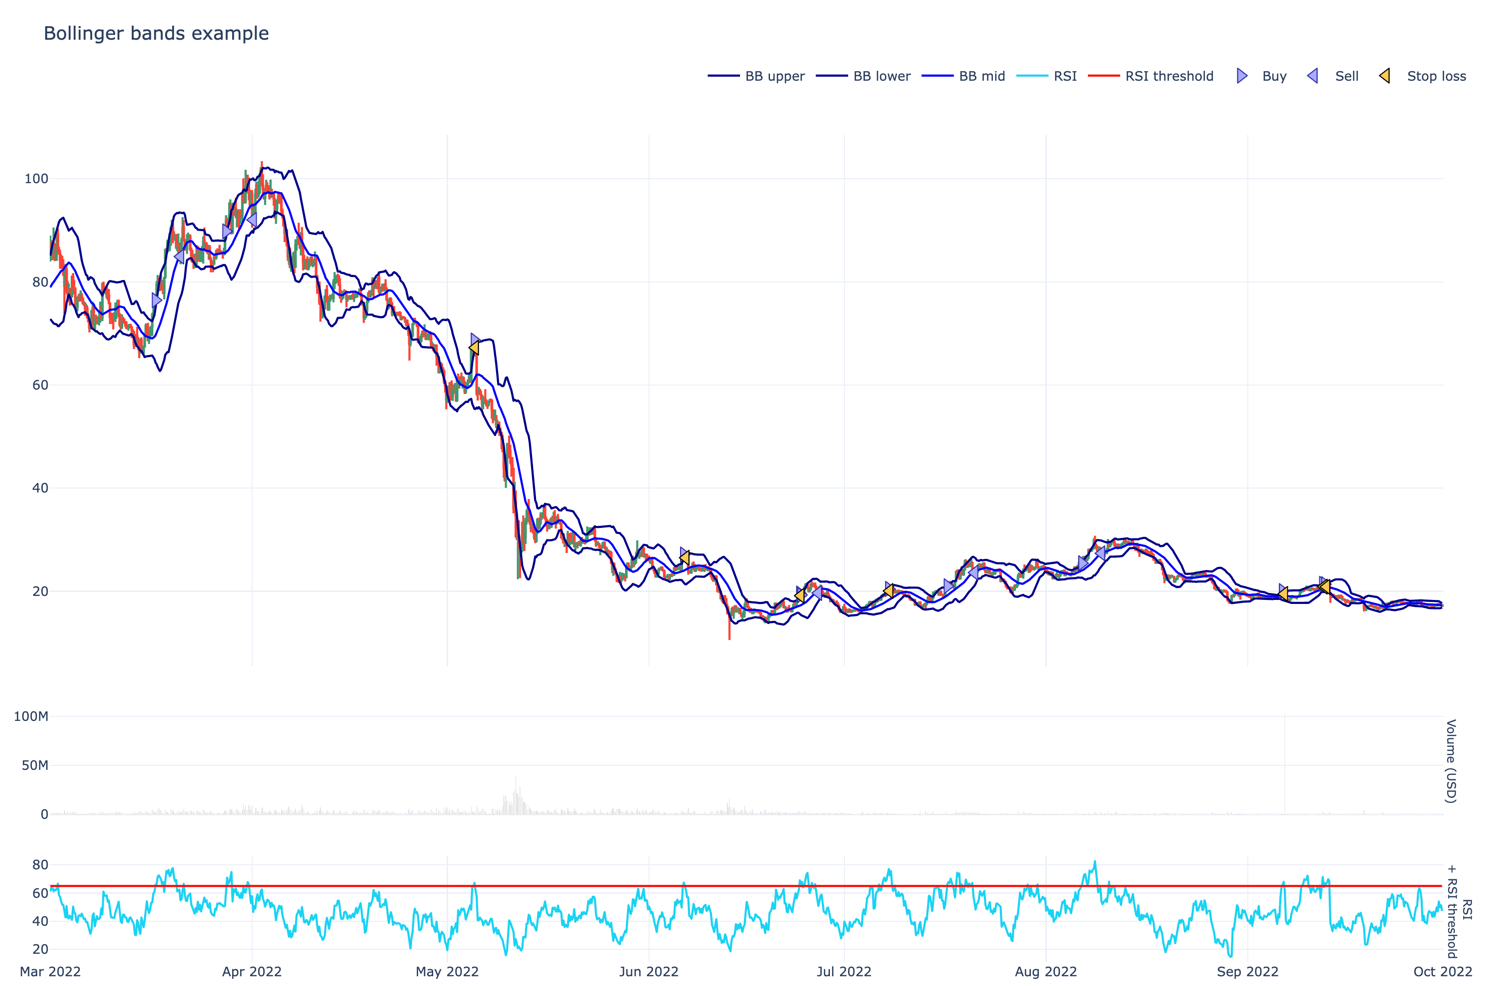
Positions taken
Here is a screenshot of individual won/lost positions in Python strategy. You can see we have few profitable long duration positions, and very short duration unprofitable positions.
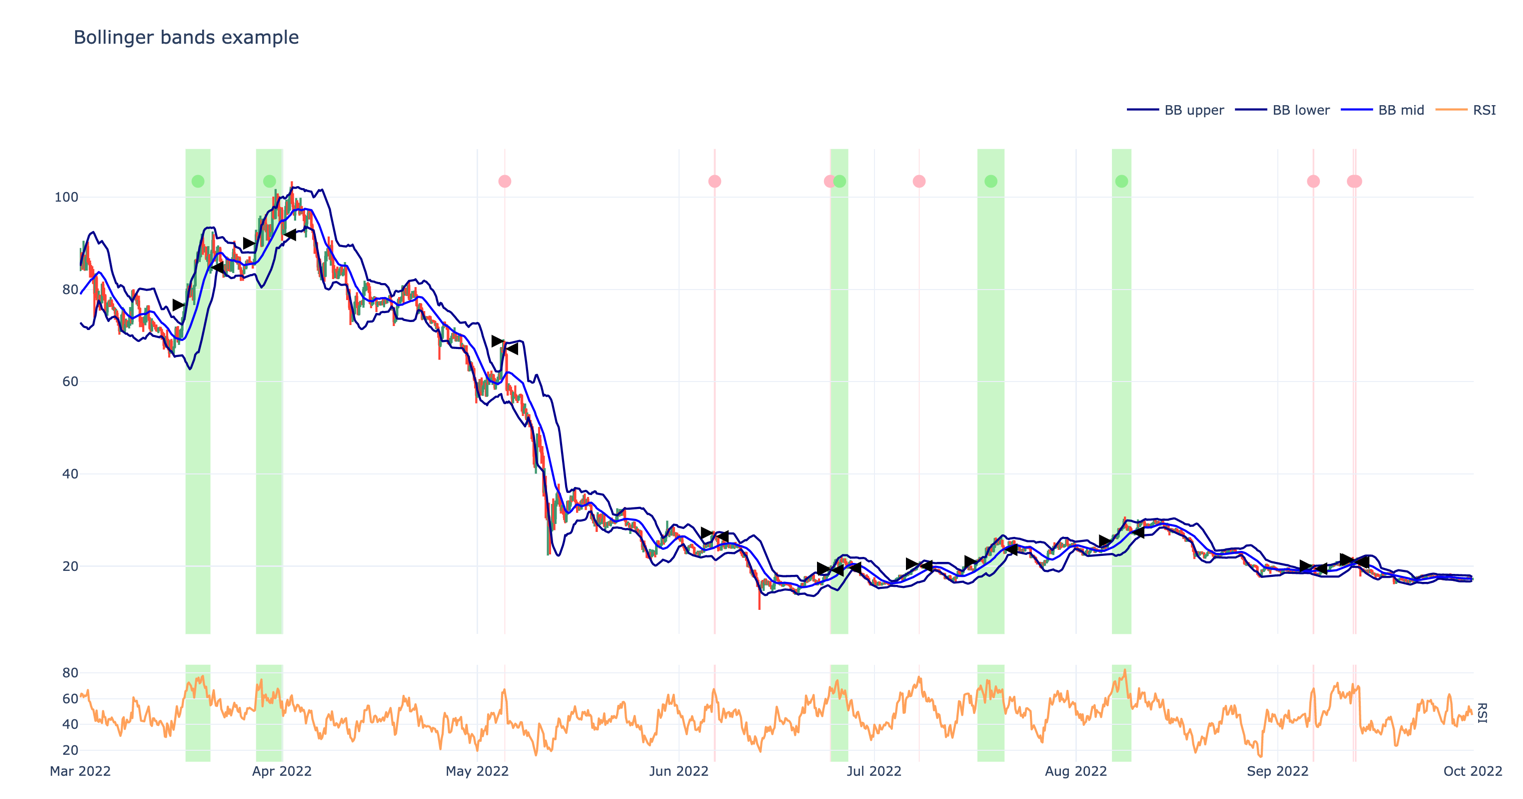
Price action and indicators
Here is a screenshot of the price action and technical indicators of the strategy.
Summary of statistics for the Python strategy
Trading period length                     145 days
Return %                                    11.90%
Annualised return %                         29.88%
Cash at start                            $5,000.00
Value at end                             $5,594.84
Trade volume                            $47,387.00
Position win percent                        55.56%
Total positions                                  9
Won positions                                    5
Lost positions                                   4
Stop losses triggered                            4
Stop loss % of all                          44.44%
Stop loss % of lost                        100.00%
Winning stop losses                              0
Winning stop losses percent                  0.00%
Losing stop losses                               4
Losing stop losses percent                 100.00%
Take profits triggered                           0
Take profit % of all                         0.00%
Take profit % of won                         0.00%
Zero profit positions                            0
Positions open at the end                        0
Realised profit and loss                   $594.84
Portfolio unrealised value                   $0.00
Extra returns on lending pool interest       $0.00
Cash left at the end                     $5,594.84
Average winning position profit %            6.72%
Average losing position loss %              -2.57%
Biggest winning position %                  12.12%
Biggest losing position %                   -2.76%
Average duration of winning positions       3 days
Average duration of losing positions        0 days
LP fees paid                                $94.87
LP fees paid % of volume                     0.20%
Average position:                            2.59%
Median position:                             1.65%
Most consecutive wins                            2
Most consecutive losses                          3
Biggest realized risk                       -1.38%
Avg realised risk                           -1.28%
Max pullback of total capital               -4.00%
Max loss risk at opening of position         1.10%
Benefits of moving from centralised to decentralised
Running your trading strategy on decentralised exchanges instead of centralised exchanges have several benefits:
- Execute your strategy in a counterparty risk free manner
- Broker free, direct to exchange
- Have 100% control of your strategy market data and live execution
- Low trading fees on efficient decentralised markets
- Convert your trading algorithm to a on-chain fund
- Benefits of rich Python quant finance libraries like pandas_ta and quantstats.
Major differences between Python and PineScript:
- Python is a general-purpose programming language, making a vast number of tutorials, books and courses available for it.
- Python is open source - making a vast number of software libraries like technical indicators and statistics available for it.
- TradingView's PineScript is optimised to be used with their service only. It is streamlined, easier to work with, but inflexible.
- PineScript is fast: backtests complete fast as it is simplified what PineScript can do.
- Python data is presented as Pandas DataFrame's - the de facto core unit of any data science, whereas TradingView uses its own data format.
- Trading Strategy's decide_trades() function is designed to suit all kind of strategies, including portfolio construction, lending strategies, liquidity provider positions and such. Thus, it will return a list of trades to be executed on a blockchain to enter a new position and you have more finer-grained control than PineScript's entry/exit that has been designed for traditional stock markets.
Some differences traders should note:
- Trading Strategy uses a term position to cover a trading position with entry and exit, whereas TradingView is using a term trade. This might be confusing because a single position consists of multiple trades.
- Because the price feed is not 1:1 same (different exchanges), different trades will be taken at a different time
- Depending on a blockchain and DEX, the assets use wrapped token notation. E.g. ETH becomes WETH. This is due to the technical limitations of EVM-compatible blockchains.
Some differences programmer's should note:
- Python uses the zero indexed arrays unlike PineScript that uses reverse arrays. In Python, like in most programming languages, the latest value of time series is in the last index of an array, noted by -1 and the oldest value is in zero index 0. In PineScript, this is the opposite, where the latest value is noted without index or index 0.
For more information on how to port your trading algorithm, please visit our GitHub repository here: https://github.com/tradingstrategy-ai/tradingview-defi-strategy