Welcome to "Feature Spotlight", where we delve into algorithmic trading techniques and equip you with valuable insights to enhance your trading strategies. In this series, we will explore various powerful tools and indicators that can be leveraged to optimise your trading decisions, all available to use on the Trading Strategy Protocol.
We first take a look into Bollinger Bands, including their functioning, implementation, and some widely-used trading strategies associated with them. Furthermore, we will explore how to integrate Bollinger Bands with other indicators to establish more formidable trading strategies. See our documentation for more details.
What are Bollinger Bands?
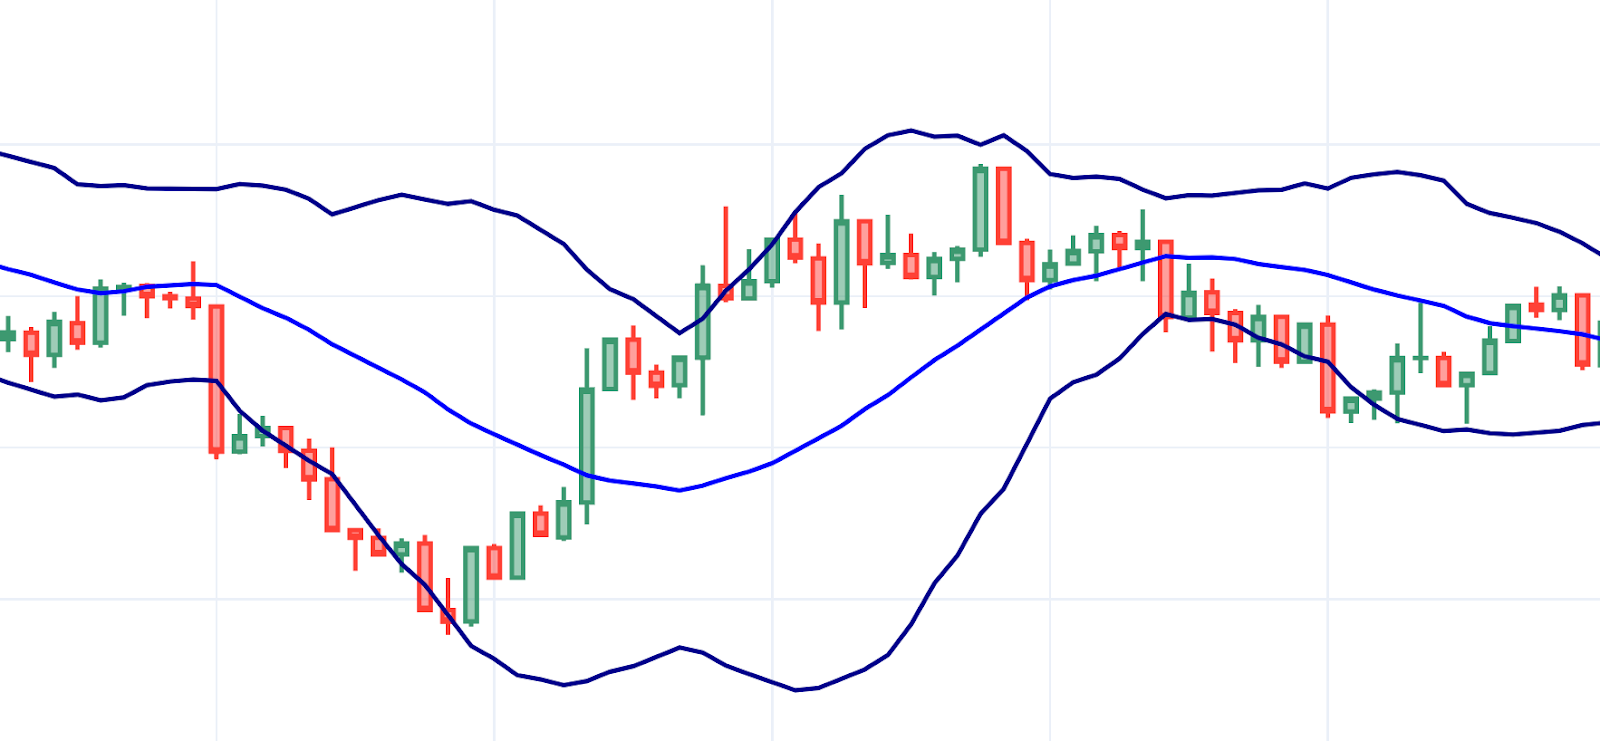
Bollinger Bands, a technical indicator tool used to measure market volatility and identify potential buying or selling opportunities. Bollinger bands are commonly used in live trading and to help develop algorithmic trading strategies.
Bollinger Bands consist of a set of three lines plotted on a price chart, with the middle line being a simple moving average of the security’s price, and the upper and lower bands serving as a measure of volatility, typically set 2 standard deviations away from the moving average.
- Middle band
A simple moving average of the closing prices over a specified period, typically 20 days. - Upper band
Typically placed two standard deviations from the middle band. - Lower band
That is also typically placed two standard deviations from the middle band.
Due to the nature of the standard deviation metric, the upper and lower bands will contract or expand depending on the price’s volatility. This means when the bands contract, it indicates a period of lower volatility, and conversely, when it expands, it indicates a period of higher volatility.
See the glossary and the picture below more information.
How to use Bollinger Bands
Here are a few examples of basic strategies involving Bollinger Bands are:
- Bollinger Bounce:
Buy when the price reaches the lower band and sell when the price reaches the upper band. - Bollinger Squeeze:
The squeeze occurs when the bands are at their narrowest, indicating low volatility. Once the price starts to break outside of either outer band, this may signal the beginning of the strong trend, so buy if price starts to break above the upper band, or sell if it starts to break below the lower band. - Monitor the Bollinger Bandwidth:
Keep track of the distance between the outer bands and the middle bands to identify periods of increasing or decreasing volatility, which may further precede a price trend change.
Why you should use Bollinger Bands
As we can see, one major benefit of Bollinger Bands is its versatility, it can be used when you want to identify trend reversals, spotting overbought or oversold conditions, and determining periods of high or low volatility. Coupled with its versatility it is also very customisable - traders can adjust the moving average calculation of the middle band or the number of standard deviations from the middle to the outer bands. However, keep in mind that the Bollinger Bands are a lagging indicator with limited predictive power by itself. Typically, it is best used in conjunction with other indicators such as Relative Strength Index (RSI) or Moving average convergence/divergence (MACD).
Bollinger Bands in action
In our documentation, we have combined the Bollinger Bands with the RSI along with the following logic:
- Buy when the price closes above the upper band and the RSI is above 50.
- Sell when the price closes below the middle band, where the middle band is the typical 20 day moving average.
This strategy gives us an equity vs benchmark chart as shown below:
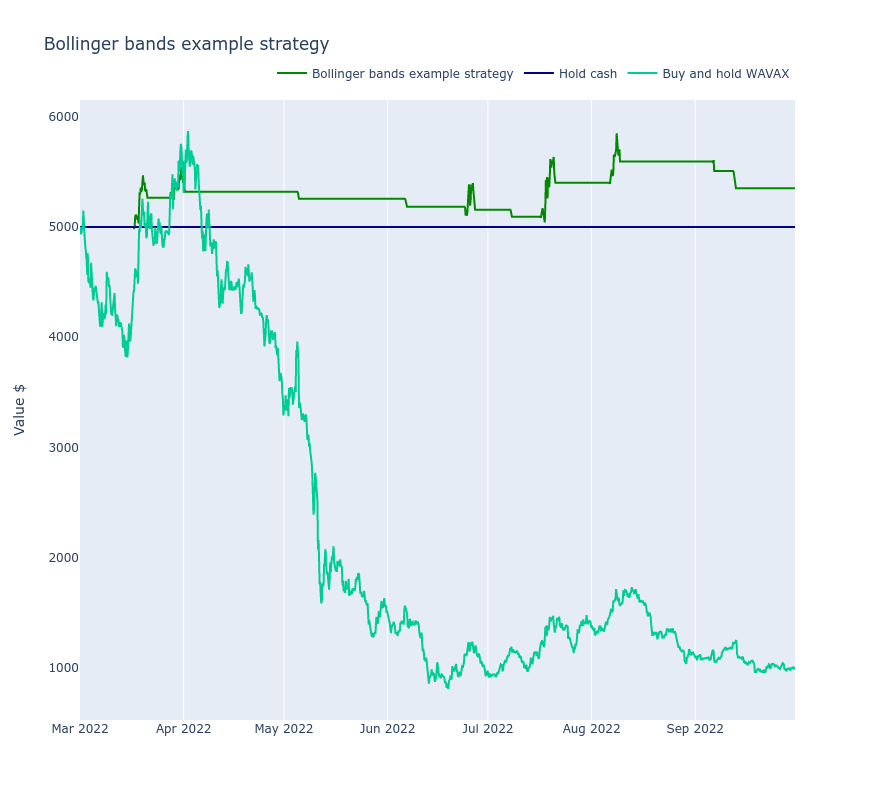
At first glance, the returns hold considerable promise. It's important to note that even during periods of market downturn, as marked by the performance of AVAX (Avalanche’s token), the strategy demonstrated a modest profit. Although our current dataset doesn't provide insights into its performance during market upswings, given its resilience in bearish periods, there's a potential for even greater profitability when the market trends positively. Remember, this analysis is based on a period when AVAX was generally on a downtrend.