What is technical analysis, and does it work? How can we predict future prices based on the past price history?
The foundation of technical analysis
Technical analysis is a branch of quantitative finance focusing on price and trading volume indicators, usually through charting and indicators calculated from this data. The opposite of technical analysis is fundamental analysis, which studies the underlying business prospects and derives the future price of an asset based on these.

The foundation of technical analysis is in statistics, and it's 50 years old. One can have a professional career in this field with certifications like a Chartered Market Technician or Certified Technical Analyst. However, there exists some pseudoscience around "watching the charts." This has been made worse by recent social media, where influencers promote their made-up content, paid chat rooms and questionable trading bots.
The efficient market hypothesis (EMH) is another opposite branch of quantitative finance, saying that technical analysis cannot work. Everything is already priced in, and past prices cannot affect future prices. We do not know when we will have efficient markets. We only know that day is not this day.
In the long term, in the era of AIs, we can expect technical analysis and fundamental analysis to merge into the larger concept of automated finance, where machines have the same access to information as humans have. Machines can make better choices, faster. Machines already beat humans in chess, poker, go and Starcraft, and there is little reason they also won't beat humans in trading.
Does technical analysis work?
Yes. Technical analysis has been proven to be successful. This does not, however, mean that it always works. The major hurdle has been transaction fees. Successful trading strategies often bleed capital in the form of trading fees. This is called the fee-sensitivity of automated trading strategies.
Decentralised finance (DeFi) changes this. DeFi trading is more efficient (low cost) than traditional finance markets. More organization functions are replaced by automated smart contracts, which do not need maintenance or management bonuses, driving the cost down. For example, Uniswap version 3 offers 5 BPS market taker fees, no spread, which is 10x-20x more competitive than centralised venues are offering for a small-ticket trader.
When DeFi gains momentum, the trading costs will lower further, and the tradeable asset universe will expand to real-world assets. This means technical analysis should become more relevant in the markets.
Can the price today tell you the price of tomorrow?
Yes. This is called momentum trading.
Momentum trading is based on the theory that most of the time, assets going up keep going up, and assets that go down keep going down. If the price went up today, it will also go up tomorrow.
Of course, this cannot happen every day. Otherwise, asset prices would never go down and keep going up to the moon. At some point, there must be a correction we may or may not be able to predict. But we don't need to be perfect oracles; we just need to be correct most of the time. As long as we beat transaction fees and the risk-free rate, and the drawdown is low enough to warrant the risk, we are making money.
Momentum trading is usually applied over multiple assets, in portfolio construction. When you trade multiple assets once, you will encounter the problems of position sizing and risk management: which assets you place your bets on. Risk management is the secret sauce of many systematic trading companies, as predicting the price movement is somewhat easier.
Momentum analysis of Uniswap pairs
Here, we examine four different assets from Uniswap version 3 deployed on the Polygon blockchain.
The original research Jupyter Notebook is available on Github.
We look at four different assets, from 2022 to 2023.
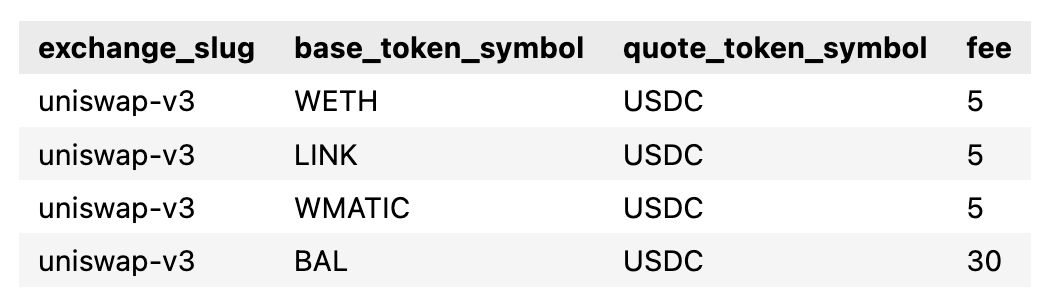
We look at both long and short trades, although short trade might be historically theoretical, as it requires a relevant lending pool (Aave) or futures markets to be deployed. DEXes and lending pools are independent, connected through DeFi composability, and deployed at different times.
We compare different time frames (a few hours, a few days, a few weeks). Generally, it is easier to predict the near-term future (weather tonight) than the medium-term future (weather next week). This principle does not always hold. There is a lot of noisiness in the cryptocurrency market. The short-term price movement might be lost in the noise, and the transaction fees for the small price movements severely affect the realised profit and loss. We want to capture large price movements, not small ones.
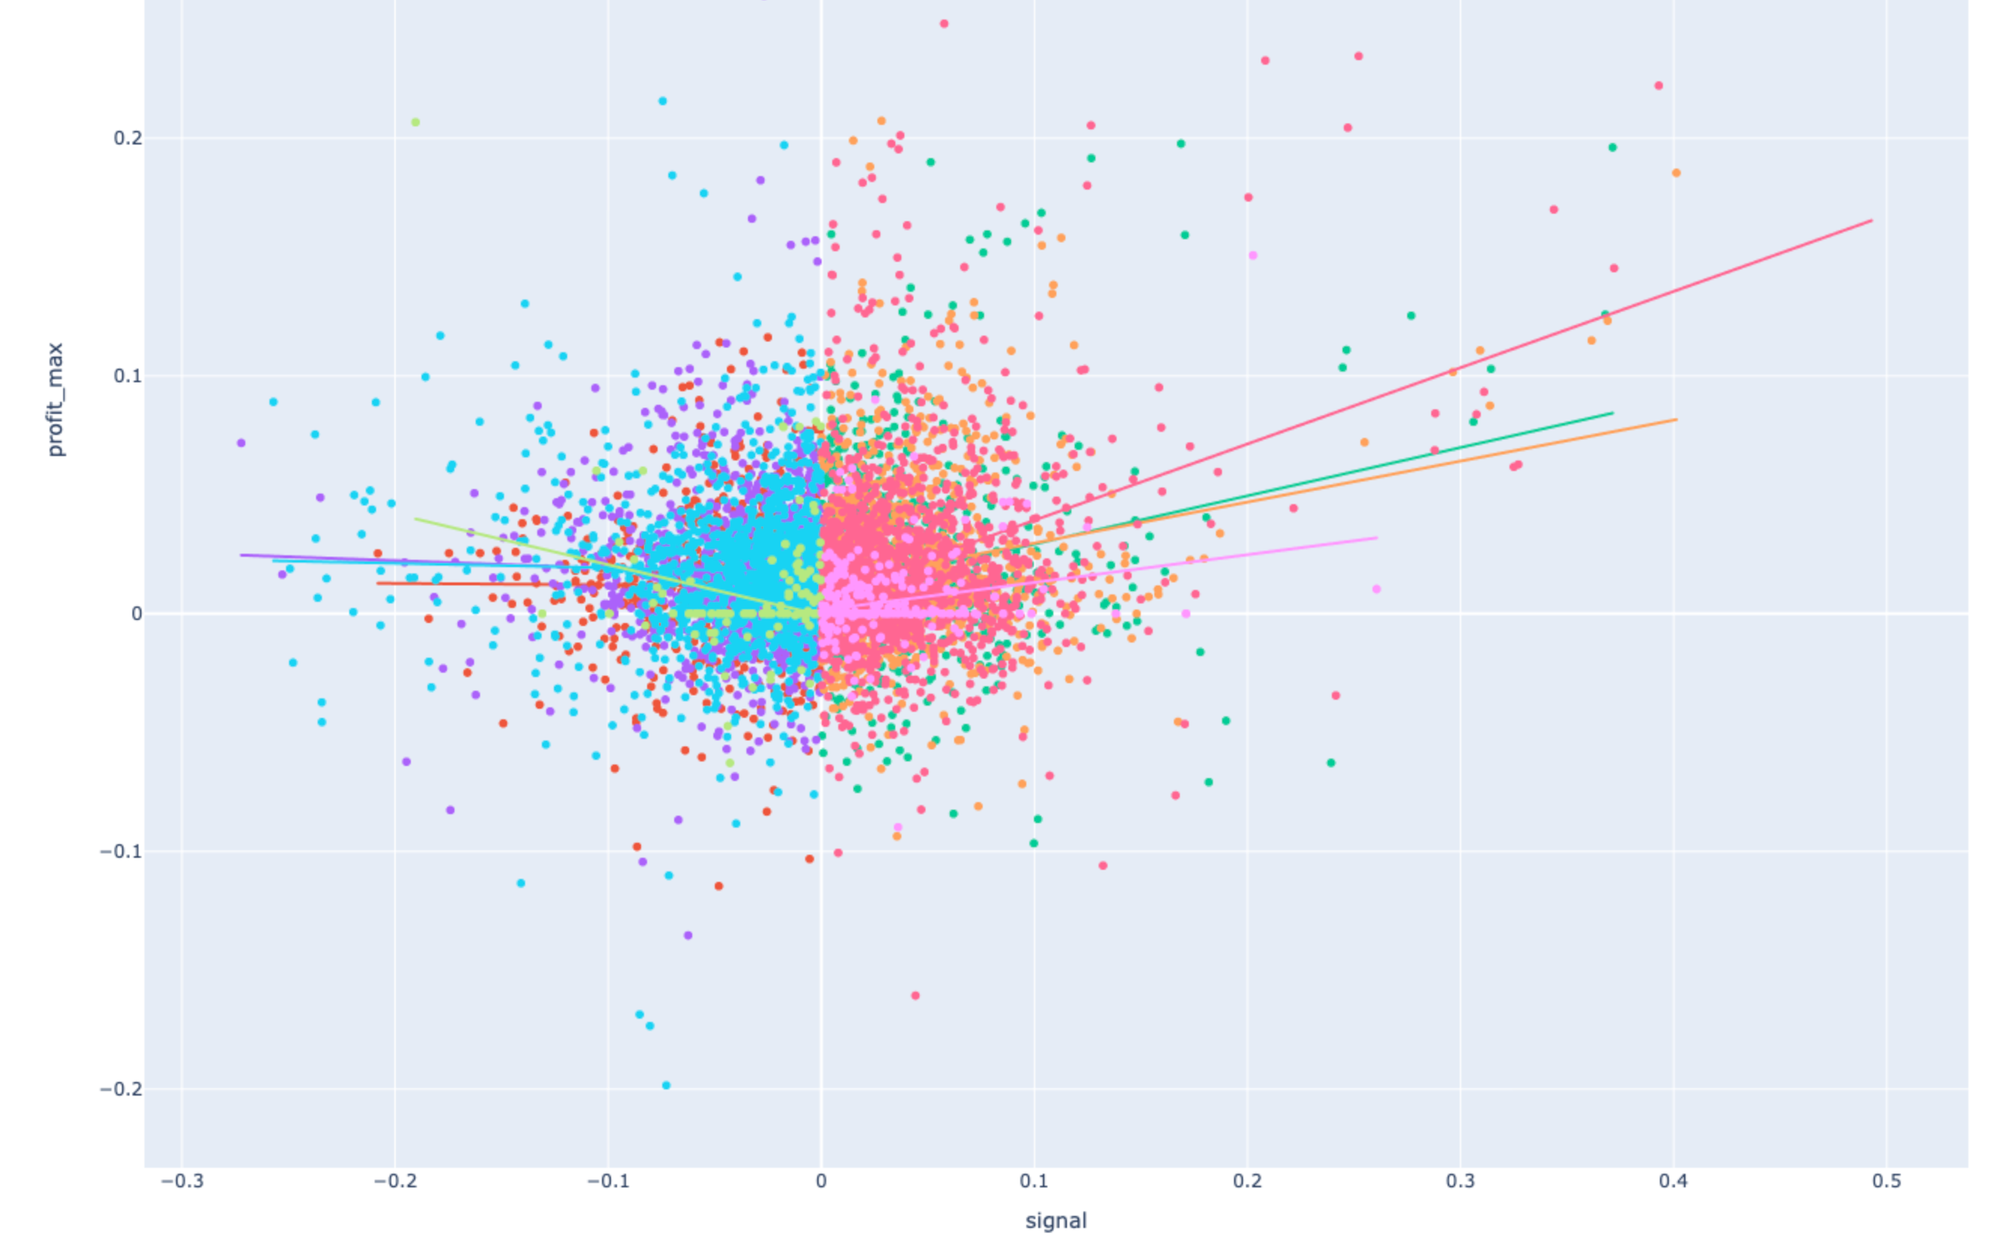
We use the most naive technical indicator: momentum, defined as the past relative price change. Periods we use in this blog post are 14d, 7d, 2d + 1d, but they could be anything. The past price change is normalised to a trading signal. Then, we plot out different charts which show whether this trading signal correlates with the future price (7d, 1d, hours). We look at the future price at the end of the period and the maximum future price. The latter is a theoretical price which assumes we can somehow execute a perfect trailing stop loss, closing the position and its peak of the future price period.
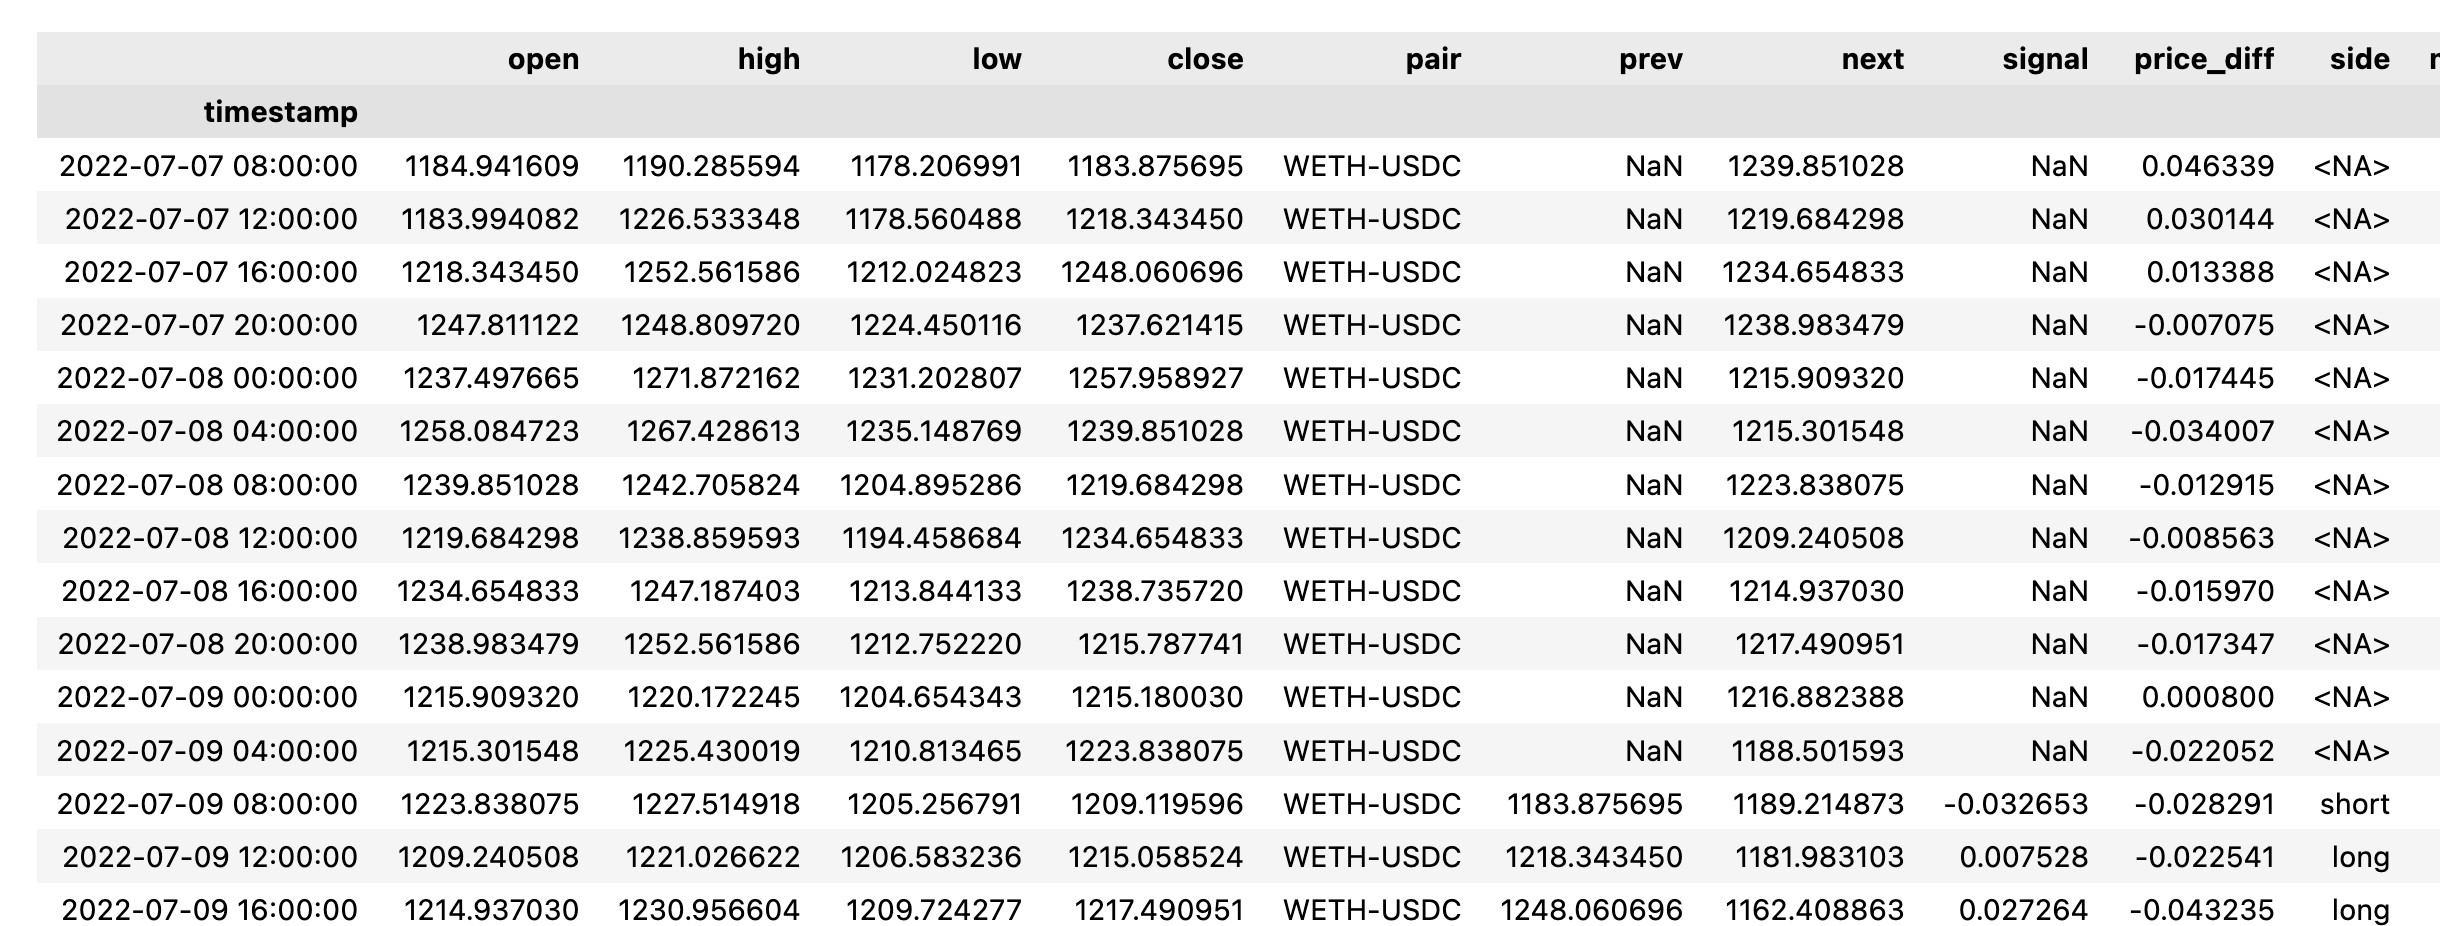
Here is a short Python and Pandas code summary of how signals and profits are calculated
A sample of data:
Overview of different time frames
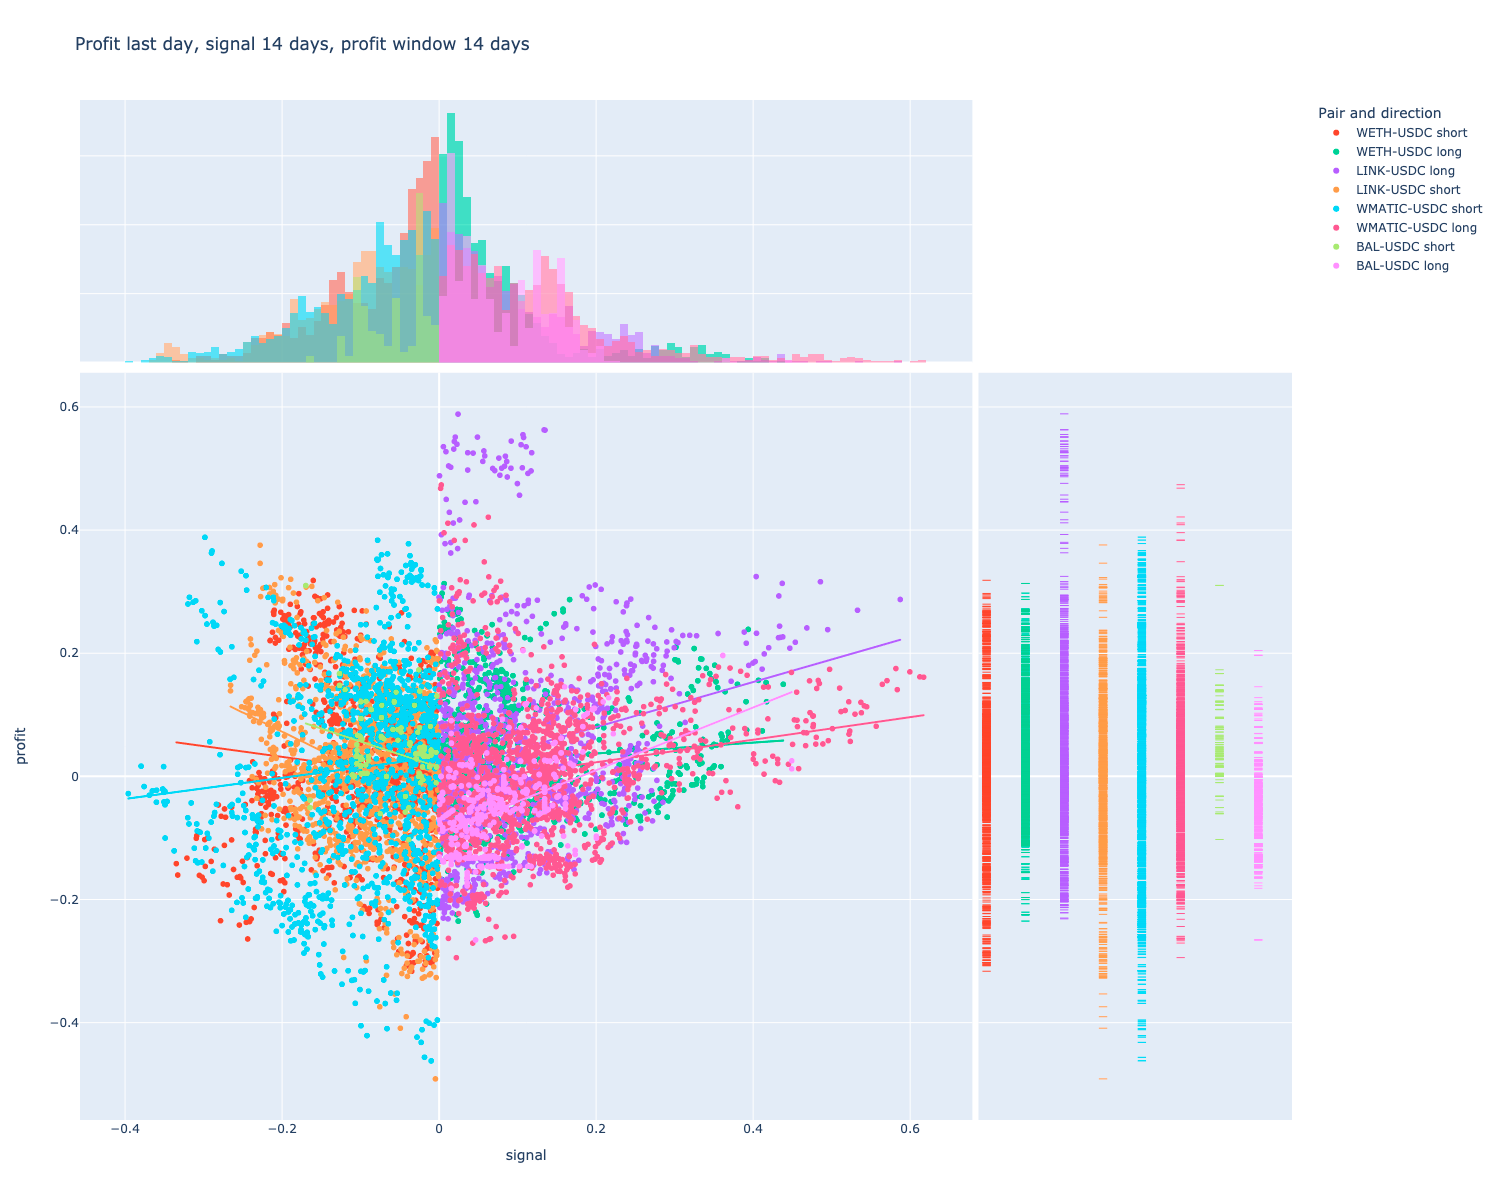
Here, we look at the trade on different assets and timeframes
- What is the future price at the end of a period
- What is the maximum potential profit during the future price period, assuming we can execute trailing stop loss
- We show an ordinary least square trendline (linear regression) to see if there is any simple trend in the noisy data
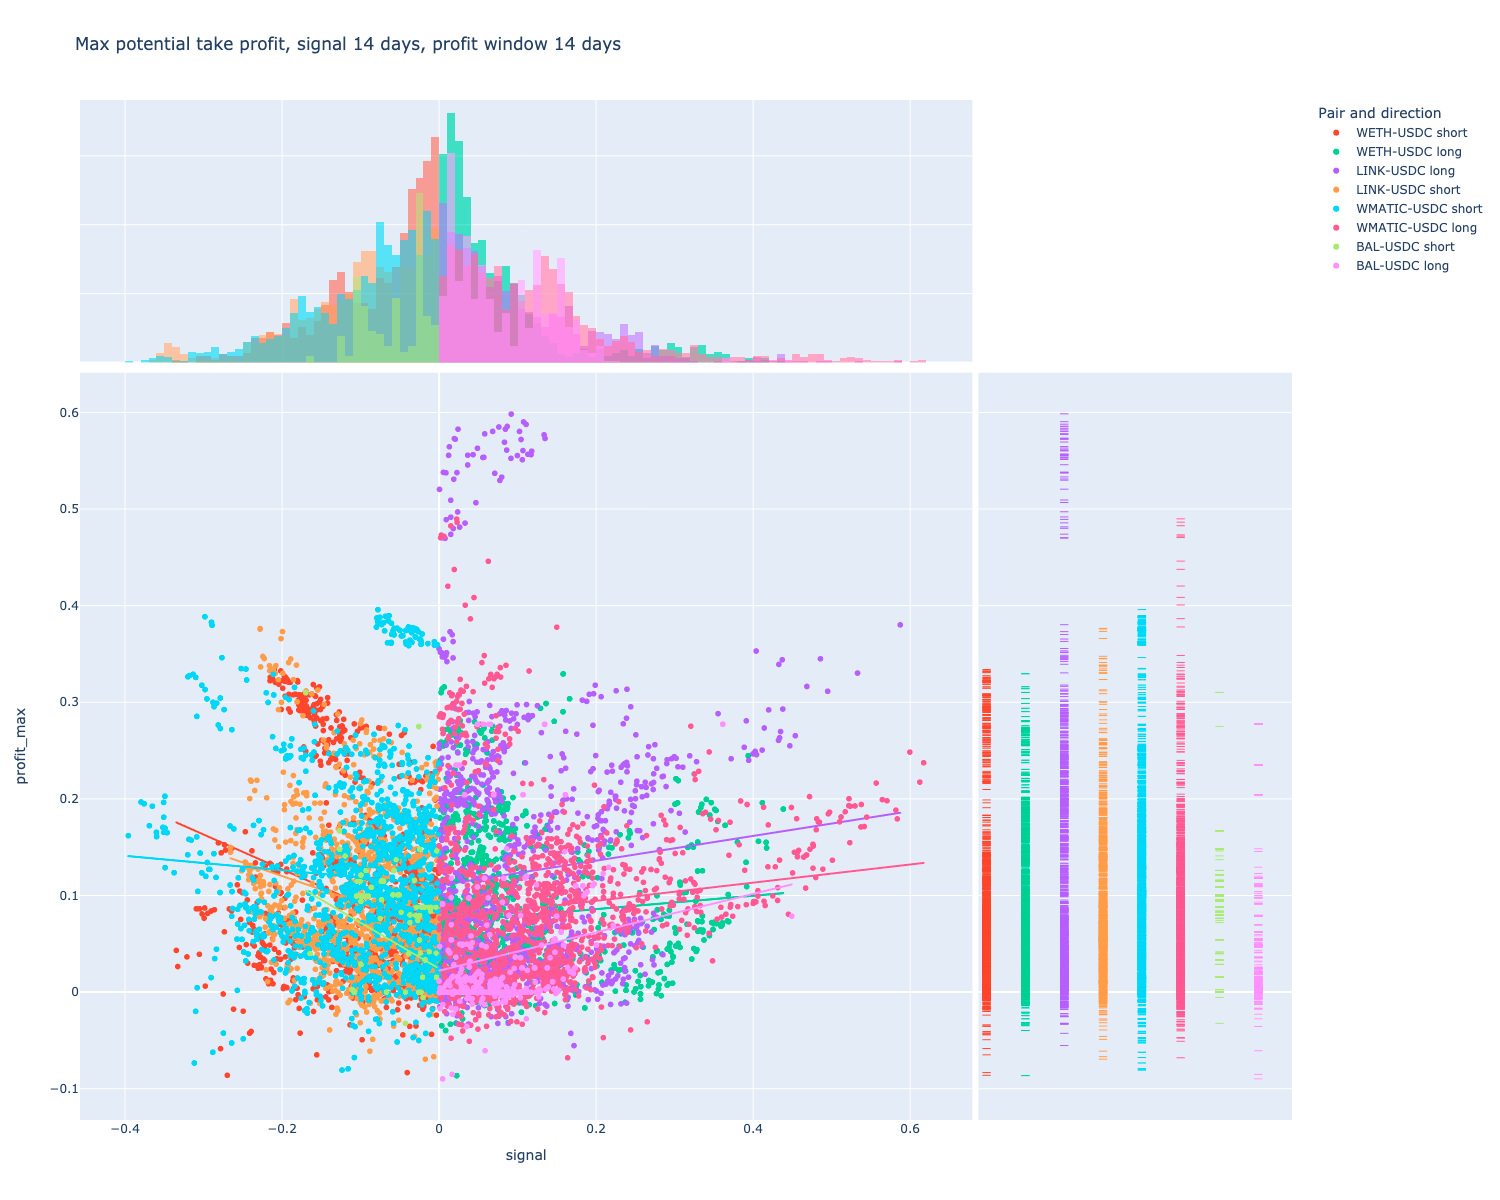
14 days
Future price:
Maximum potential take profit:
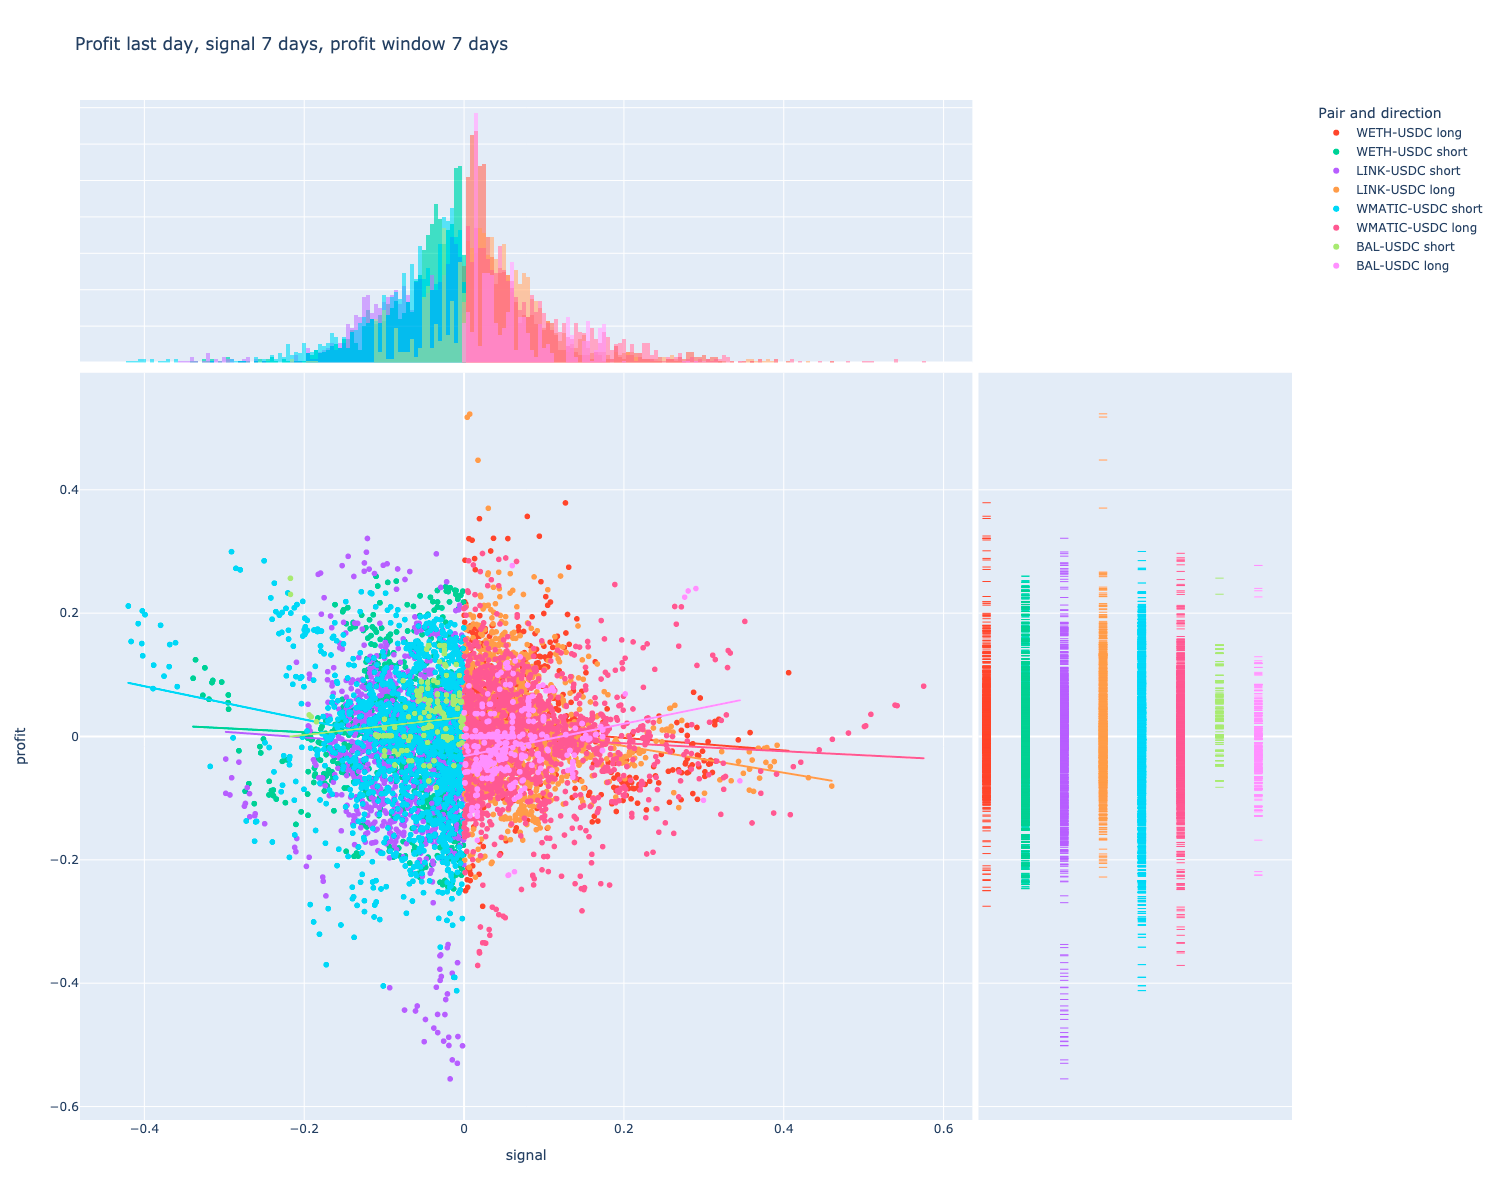
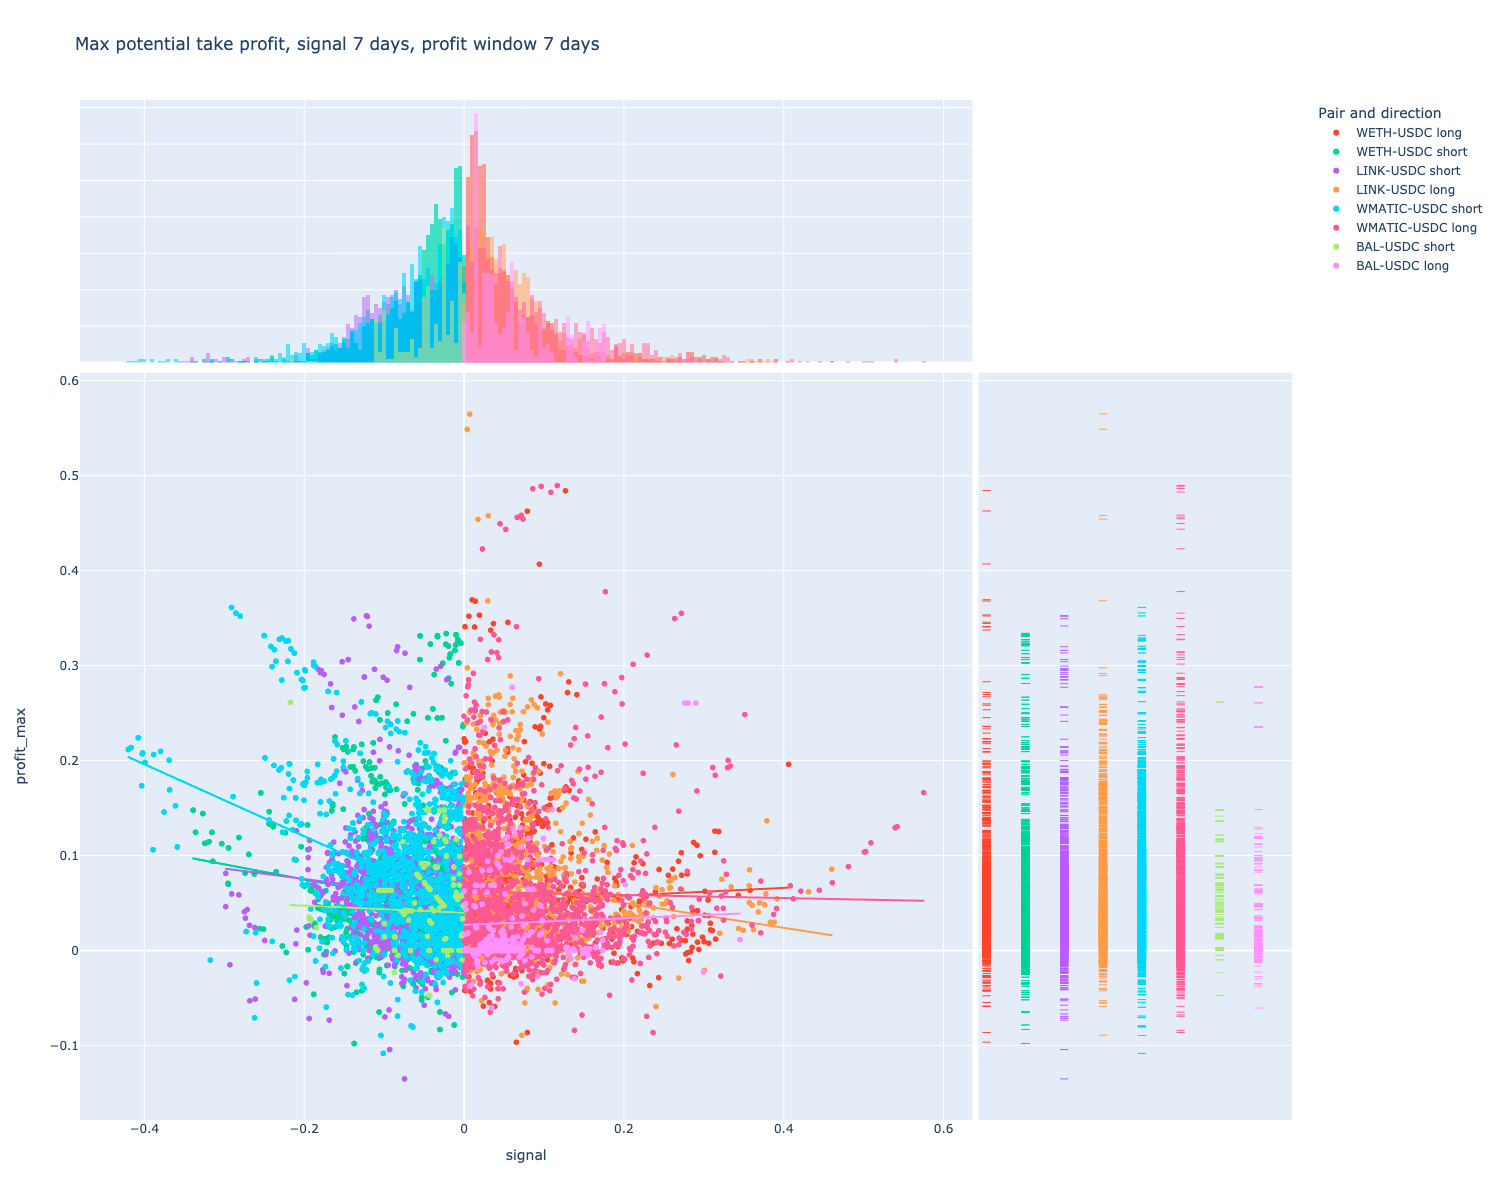
Seven days
Future price:
Maximum potential take profit:
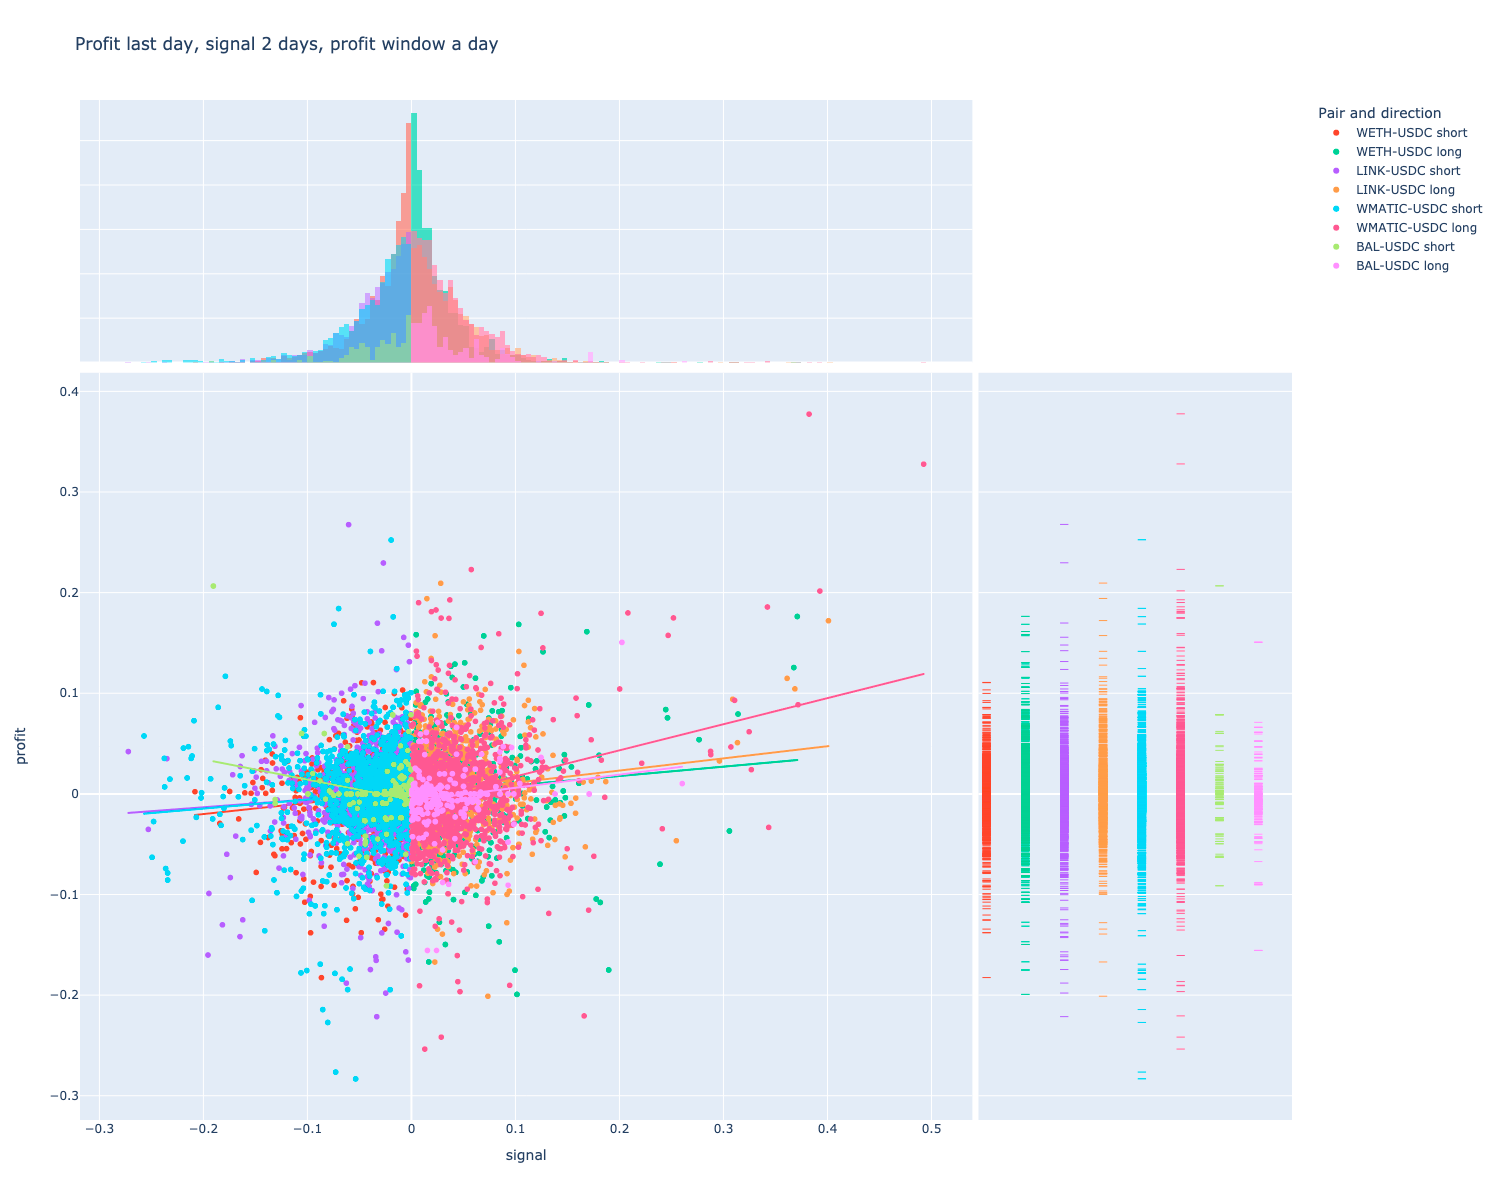
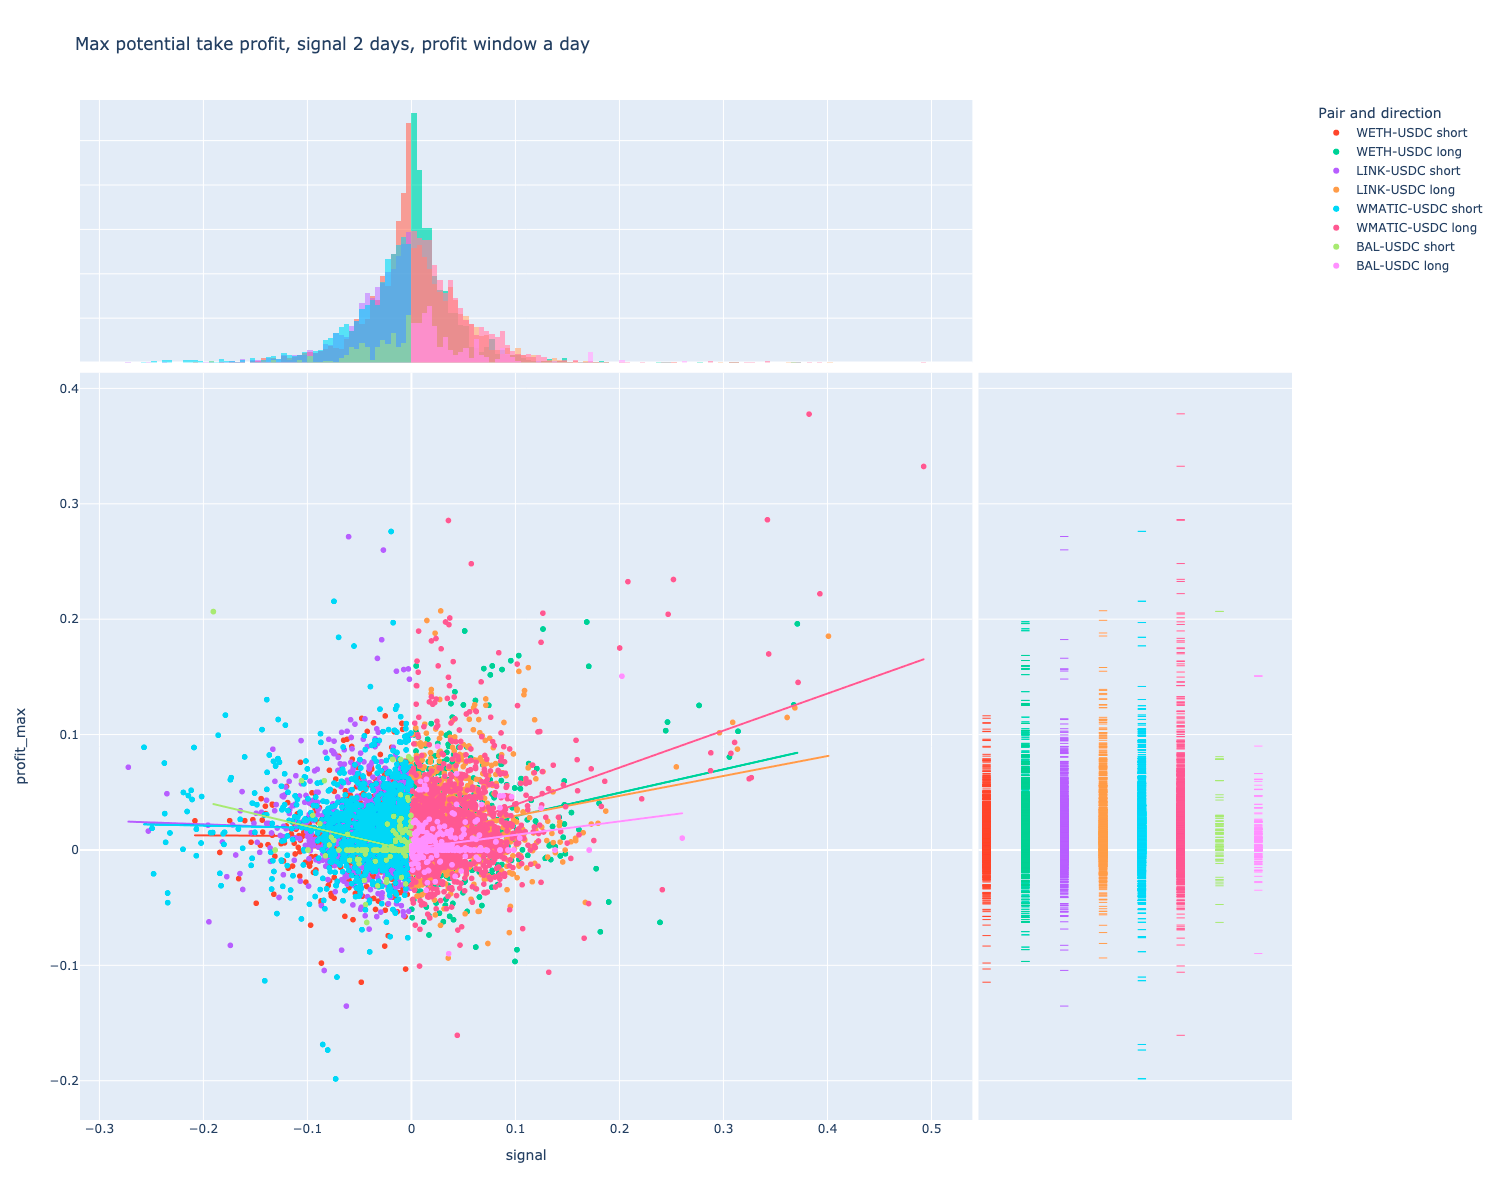
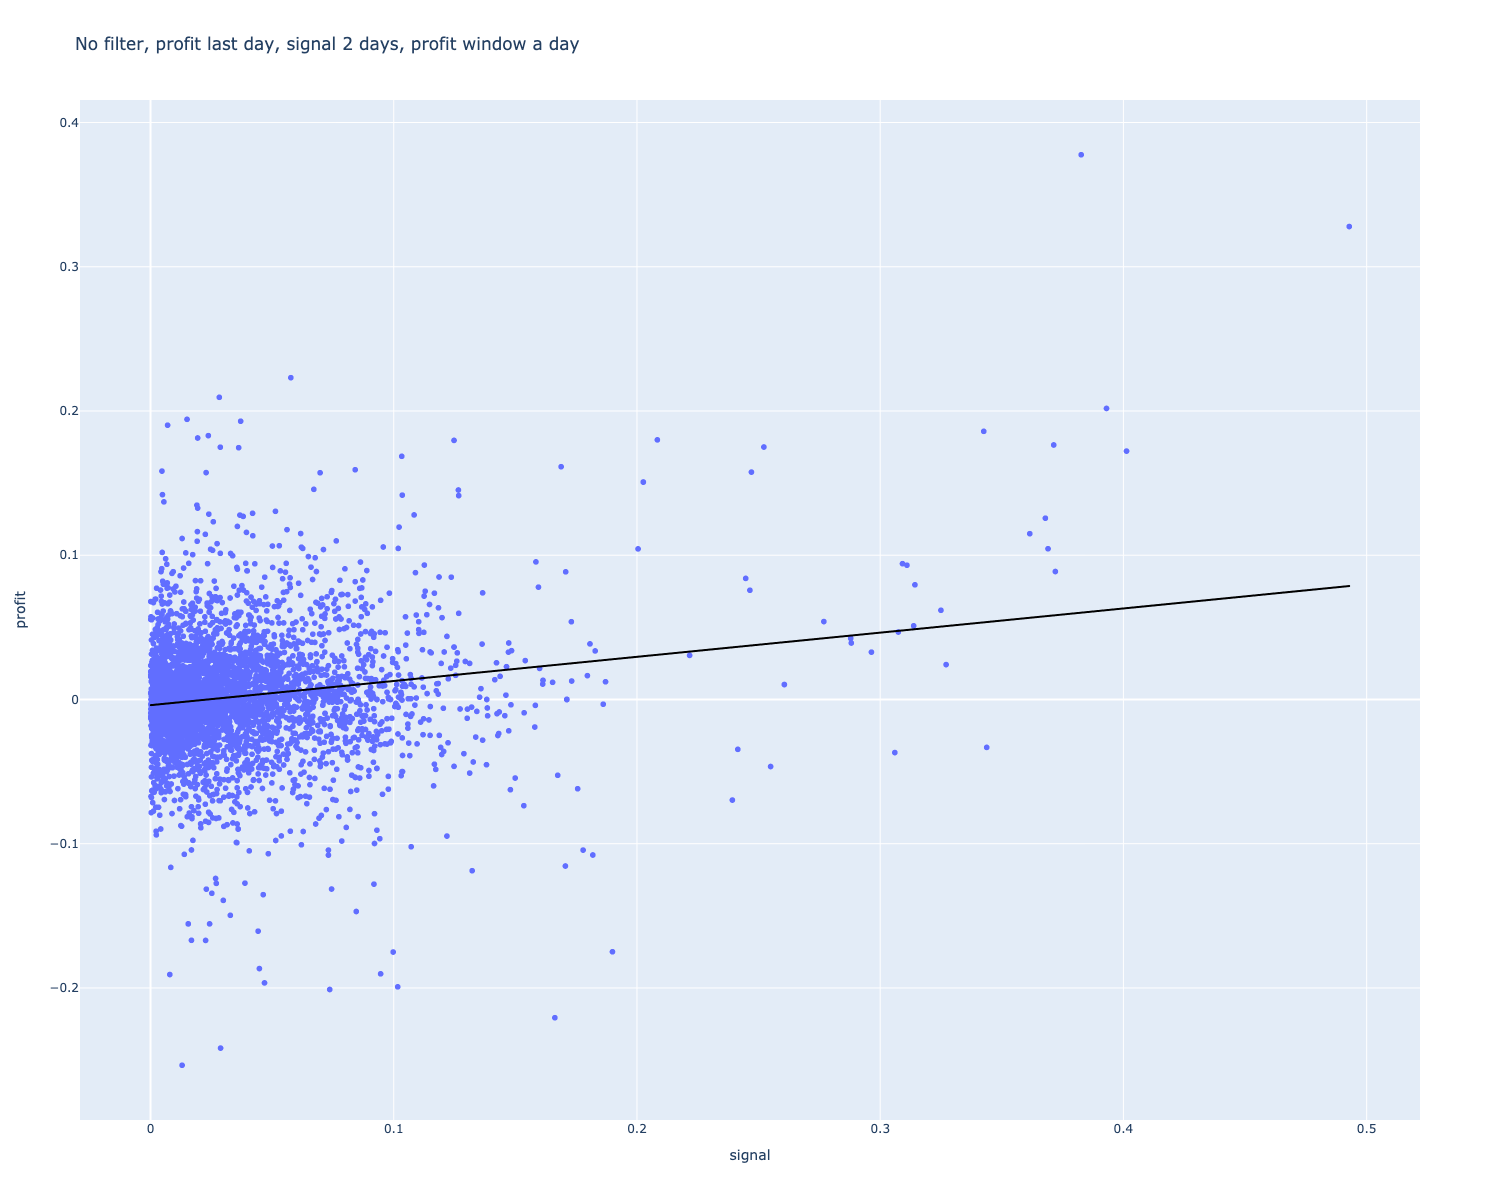
Two day look back, 1 day look forward
Future profit:
Maximum potential take profit
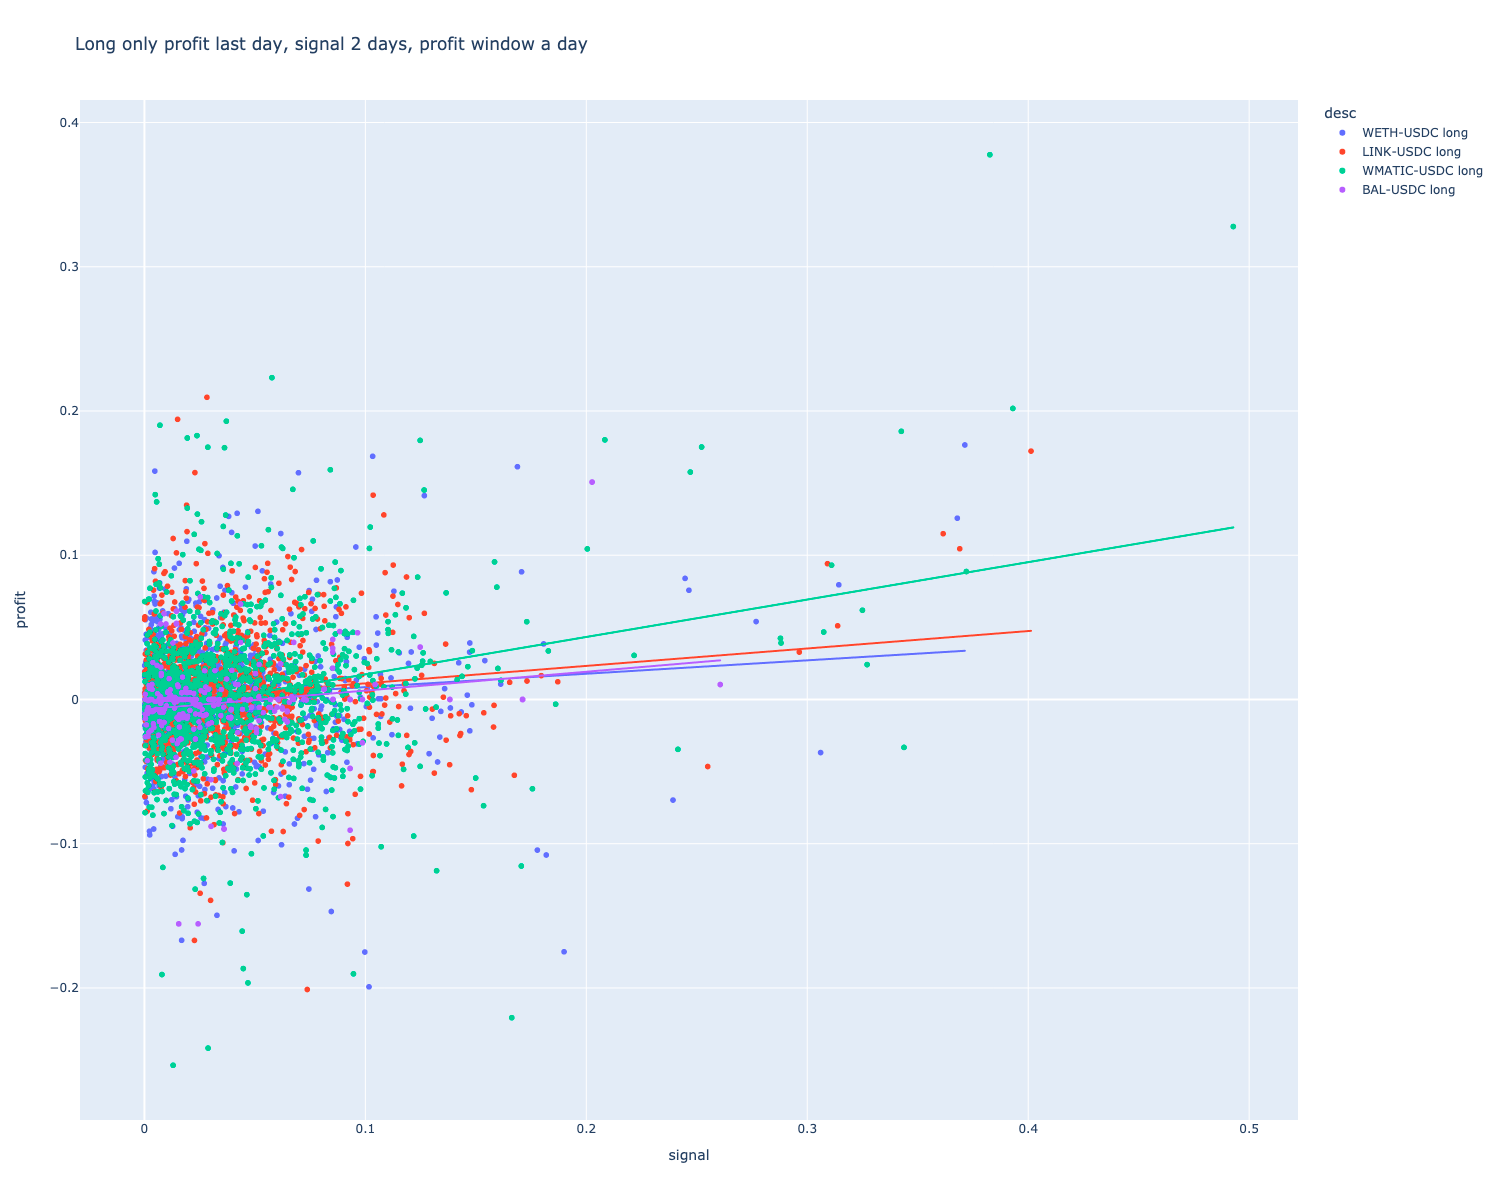
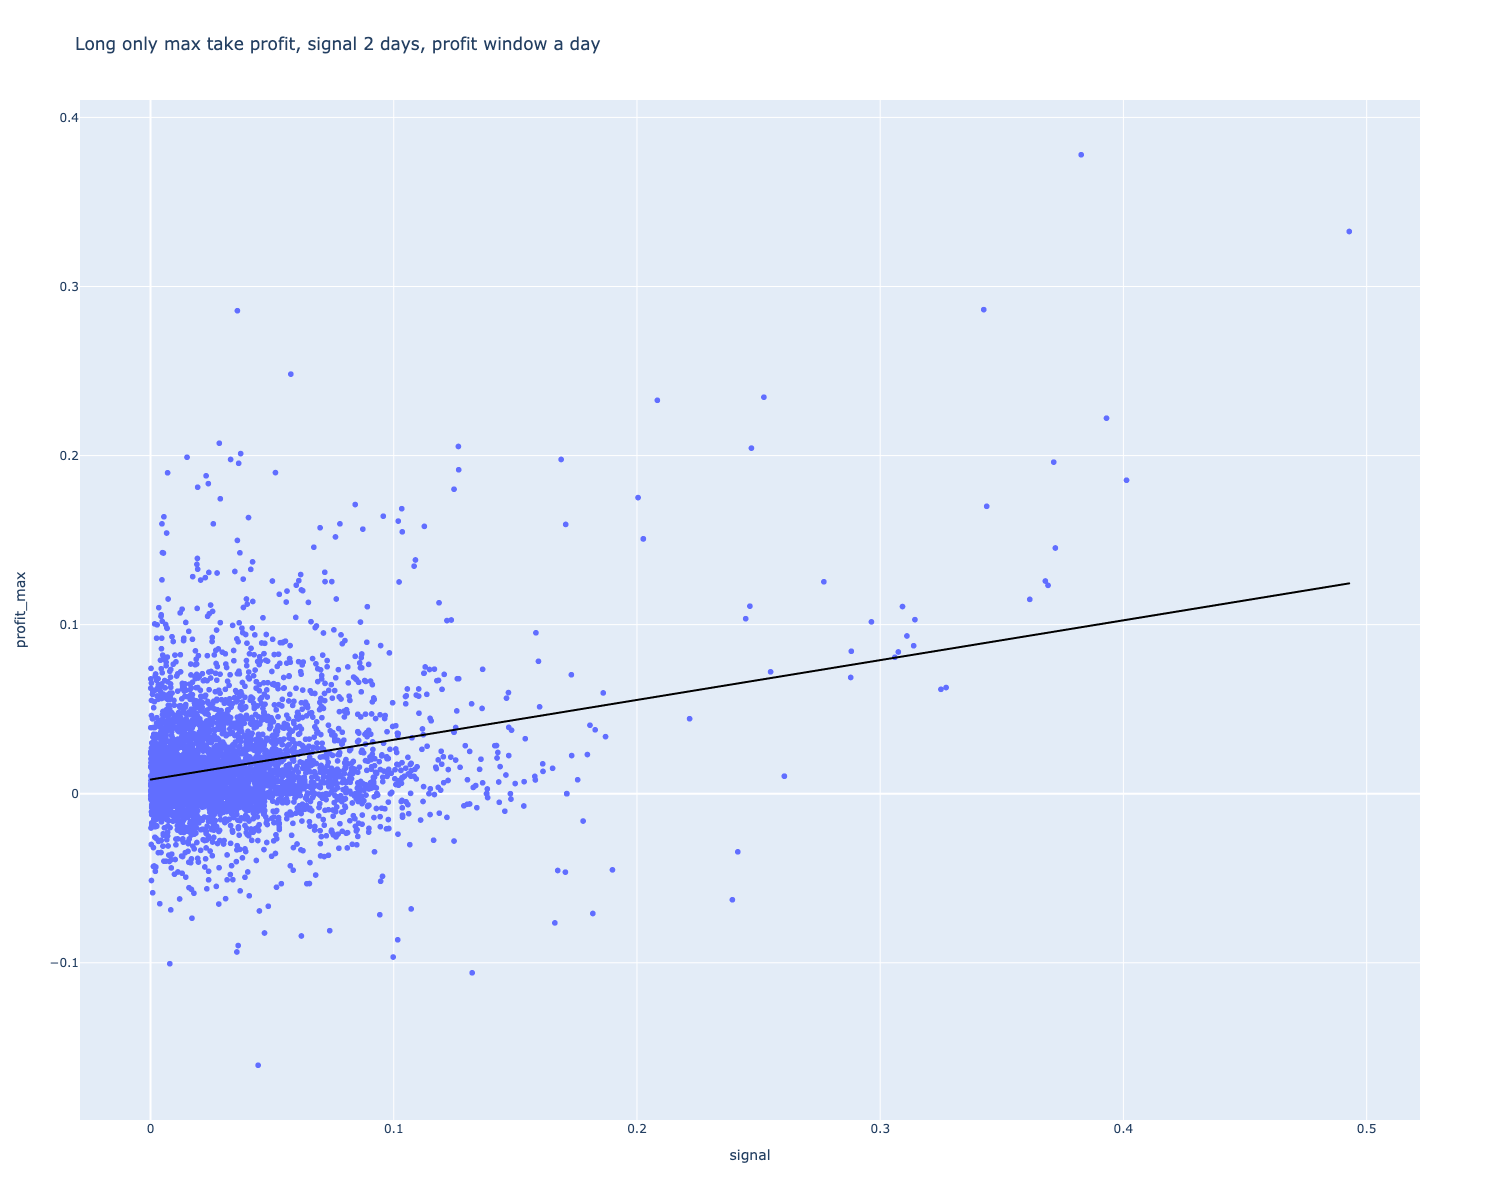
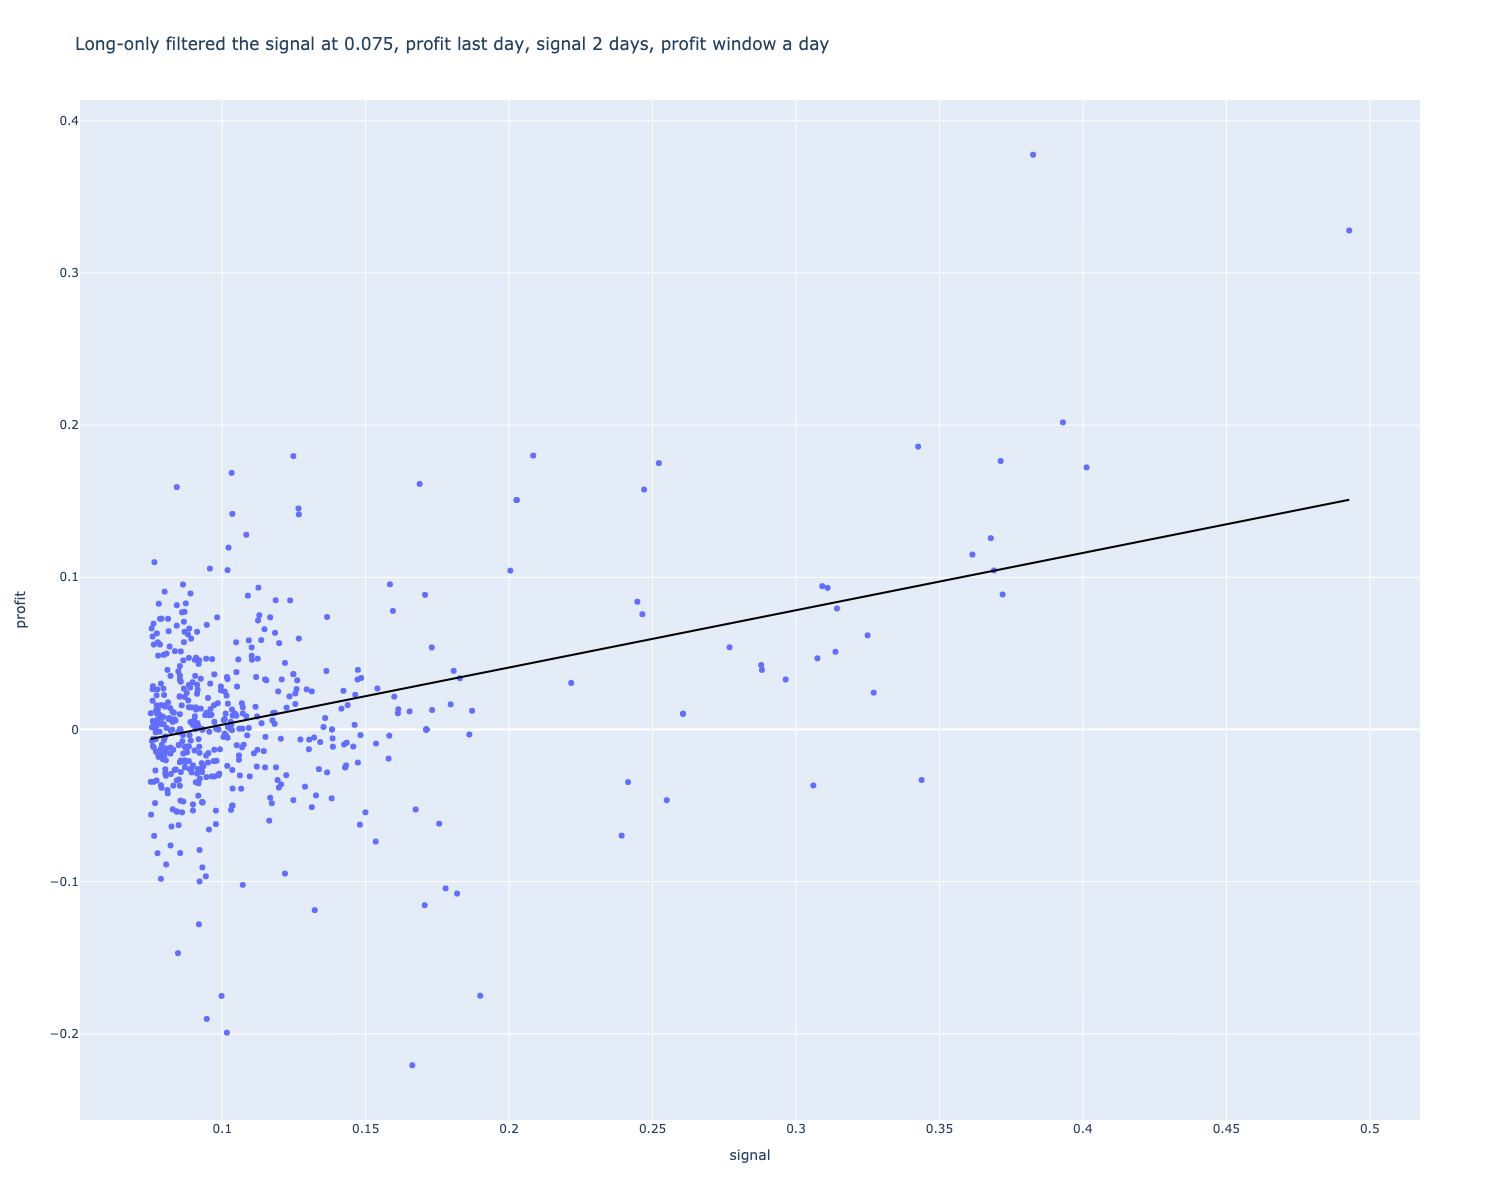
Long only side
We can examine both trade sides independently.
- We look at the two-day signal for longs, as it was the most promising on a quick overview of previous charts.
- For shorts, we ignore this, as none of the time periods did not seem to have promising results on the quick look.
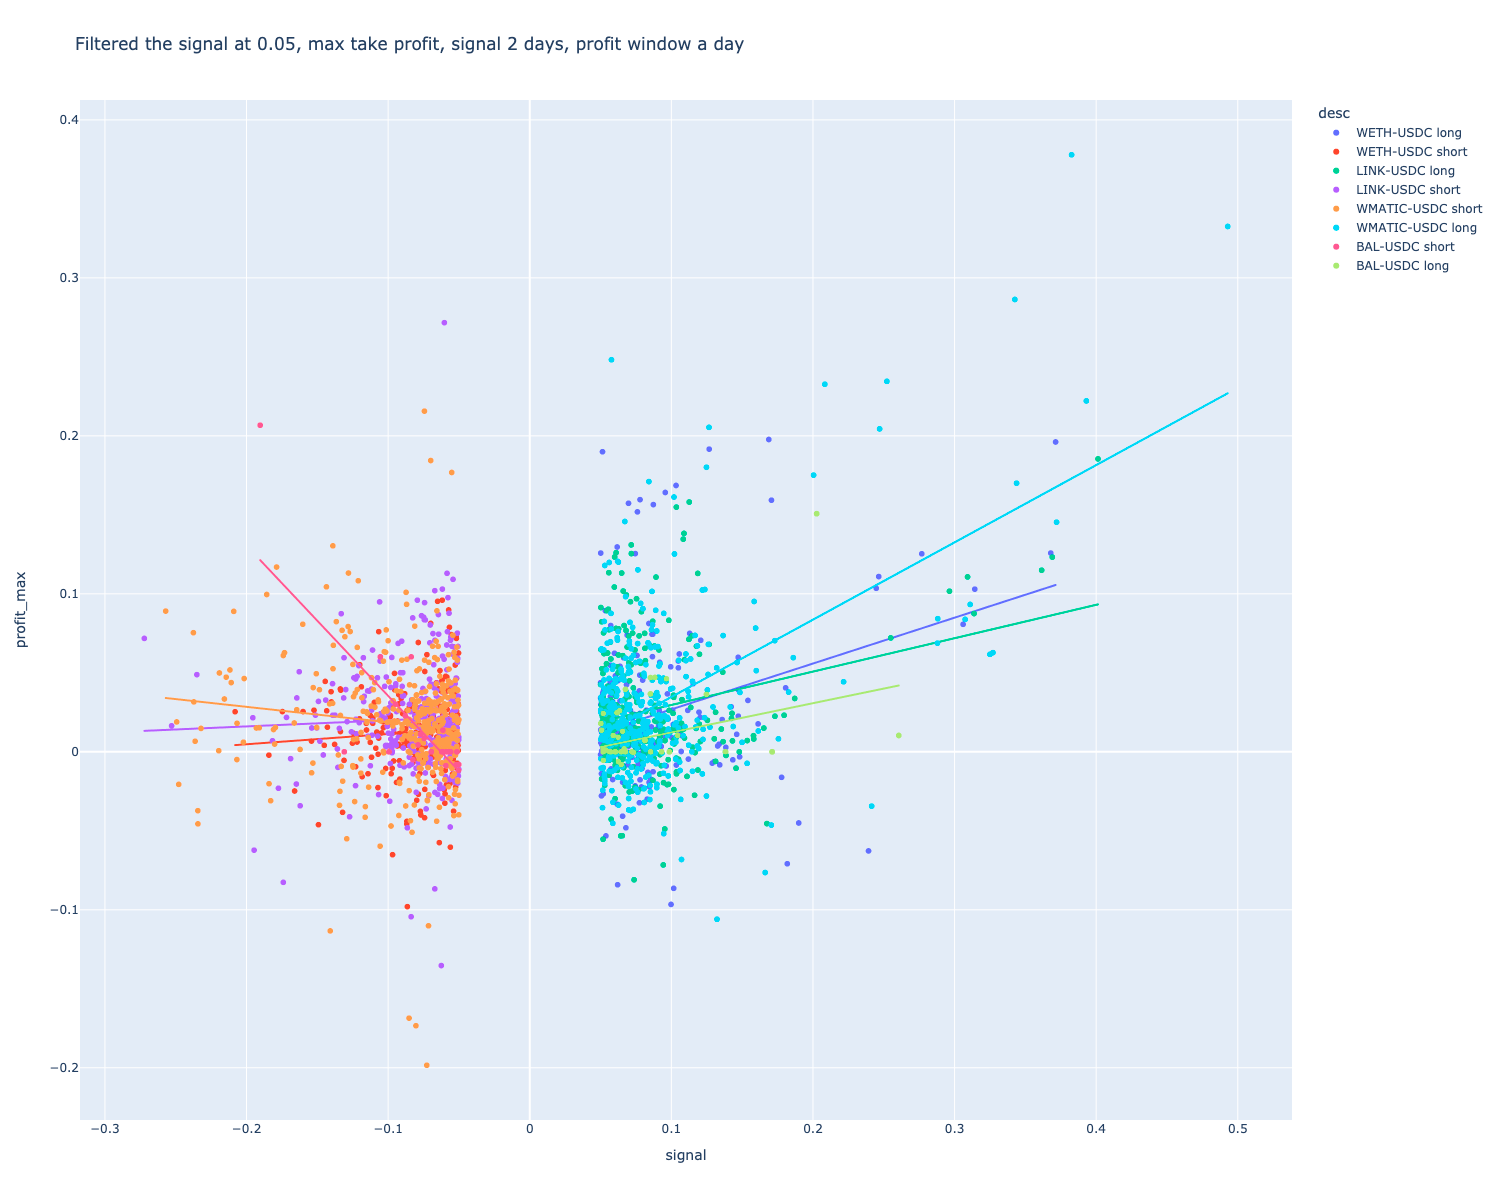
Filtering the signal
So far, we have looked at raw momentum signals without filtering. We apply a filtering threshold that culls out weak signals. This has a noticeable effect on the trendline on the long side, but mixed results on the short side.
Filtering means we are more sure about our signal, but will have fewer trading opportunities.
Conclusion
If you are interested in technical analysis of DeFi markets, see the Trading Strategy open source framework for market research and algorithmic trading.
For any updates and follow-ups, subscribe to the newsletter or follow on Twitter, LinkedIn or Telegram. For any questions, join Trading Strategy Discord server.