
Using technical analysis and indicators can be a lucrative way to conduct trading, but it can also be a challenging and confusing one. That's why it's essential to have a good understanding of the tools and indicators used in systematic trading. One such tool is the Relative Strength Index (RSI). We take a dive into what the RSI is and how to use it.
What is the Relative Strength Index (RSI)?
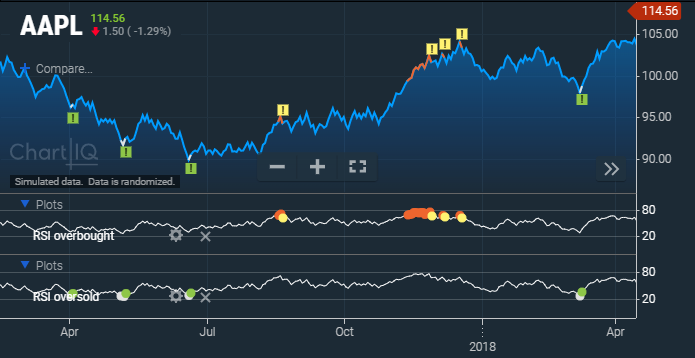
First introduced in 1978, the RSI is a momentum indicator that measures the strength of an asset's price movement by comparing the speed and magnitude of recent gains to recent losses. The RSI ranges from 0 to 100, with readings above 70 indicating that an asset is overbought and readings below 30 indicating that it's oversold.
How do you use the Relative Strength Index (RSI)?
To use the RSI, traders must first add the RSI indicator to their chart. This can typically be done by selecting the RSI from a list of technical indicators in the charting software. Once the RSI has been added to the chart, traders can use it to identify potential entry and exit points for their trades. If you are interested in the formula and how to calculate RSI see the image below.

If the RSI is showing that a particular cryptocurrency is overbought, it may be an appropriate time to sell. On the other hand, if the RSI is indicating that a cryptocurrency is oversold, it could be a good time to buy. The idea of the RSI is to help provide the trader with evidence of trend movement or to help validate buy and sell signals using mathematics and historical data.
It's also crucial to understand that the RSI is a lagging indicator, meaning it may provide signals after a trend has already started. To account for this, traders may choose to use other technical indicators in conjunction with the RSI to confirm potential trades. For instance, traders may also look at candlestick patterns, trendlines, and moving averages to gain a more comprehensive understanding of the market.
One important aspect of the RSI is that it is typically calculated using a 14-day period, which can be adjusted to suit the trader's needs. Shorter periods may result in more volatile RSI readings, while longer periods may provide a smoother and less volatile reading.
Is the Relative Strength Index (RSI) useful?
The RSI is a useful tool for traders as it helps predict price behaviour of an asset, assist in validating trends and reversals, and provide short–term traders with buy-sell signals. While the RSI is not a foolproof indicator and should be used in conjunction with other analysis tools, many traders find it useful for identifying potential entry and exit points for trades. Additionally, by understanding the 14-day period calculation and the ability to adjust it, traders can tailor the RSI to suit their specific needs and trading strategies.