Trading Strategy has one of the most comprehensive market data sets for decentralised markets, converting raw on-chain data to familiar candle format. However, with an abundance of data available it’s important for us to create well designed and intuitive charts that will enhance your market analysis. Charts are a technical trader’s portal to the markets and essential for algorithmic trading. We will take you through how we created a best-in-class charting solution that enables you to make the most informed technical analysis and trade executions
Procuring a charting solution
In our charting software evaluation, we were looking for a solution that combined a best-of-breed user experience with advanced technical analysis capabilities needed to support our long-term requirements. For our initial implementation, we wanted to provide customers with standard candlestick trading charts alongside custom liquidity visualisations unique to our decentralised exchange (DEX) market data.
We initially considered several open source charting solutions, but ruled them out due to lack of maturity and advanced features. Next, we evaluated TradingView’s charting library, drawn by its ubiquity in the trading community and the familiarity of its interface to traders. We quickly discovered limitations in its data model and customisability – for example, it lacks support for custom metrics beyond the default OHLCV values (required for our liquidity charts). However, during the procurement process one solution stood out. Enter ChartIQ…
Bringing market data to life
Cosaic's ChartIQ brings customised, complex datasets to life for all sectors of finance, including cryptocurrency and now within the DeFi space. With users around the world, ChartIQ’s powerful HTML5 charts elevate any financial platform to best-in-class. Cosaic has already entered the cryptocurrency market supporting many centralised crypto exchanges, however this is their first entry into the decentralised markets and the DeFi space. By providing state-of-the-art charts to crypto vendors, it allows crypto traders to have similar if not the same functionality traditional fiat traders might expect.
“Trading Strategy’s evaluation and subsequent selection of ChartIQ for its DEX Market Data visualisation is a big win for both our team and Trading Strategy end users,” says Cosaic Chief Product Officer Eugene Sorenson. “There is no charting solution better suited to bring complex data sets to life than ChartIQ - whether it’s decentralised or traditional market data or any other type of time series data. Trading Strategy users can now leverage our analytical tools to drive their market assessment.”
We leveraged the ChartIQ tool to provide the best experience for our users, meaning you will benefit from efficient workflows and a new streamlined way to work whilst having access to our vast market data sets. You will be able to move beyond traditional charts to custom data visualisations and will be able to engage with actionable, tradable data.
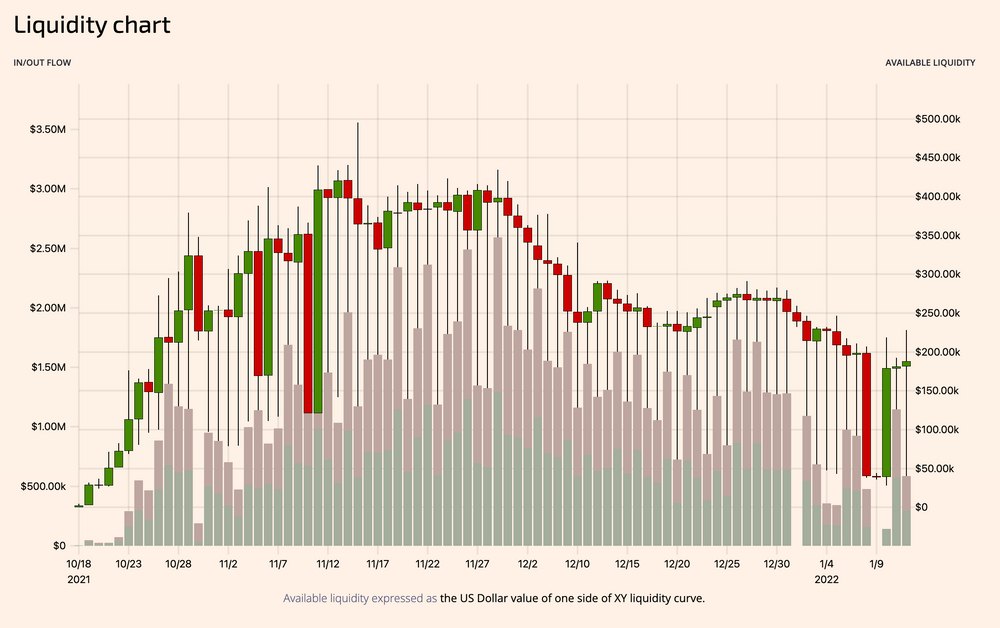
Liquidity charts
Users of the Trading Strategy platform will not only receive the most powerful chart features from ChartIQ but the holistic trading chart system created by the Trading Strategy development team. We have customised ChartIQ’s module and created a new chart to provide to you access to liquidity charts that you can view in unison with the native price and volume charts. You get access to the traditional charts you are familiar with, in addition to upgraded liquidity analytics to help you make the most informed trade decisions and execution.
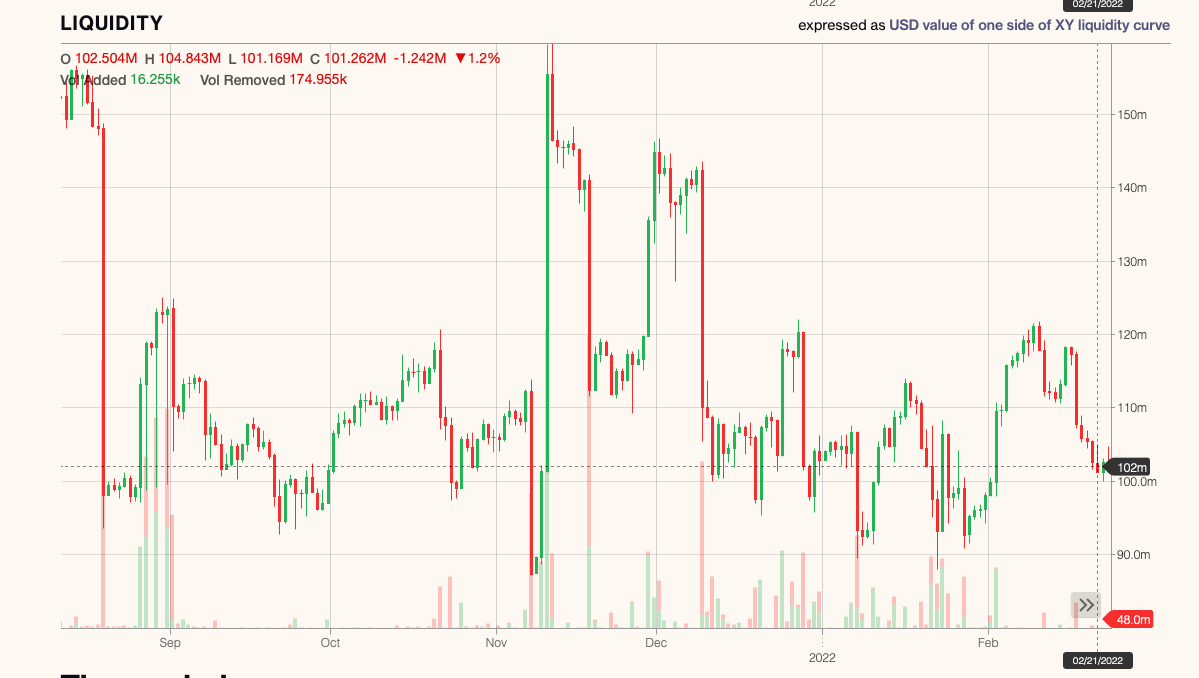
Liquidity charts allow users to analyse the stability and depth of the market and have more information on candle stick movements by matching this with the liquidity chart. Therefore, we have created price and liquidity charts that have synchronised view capabilities. This enables both charts to work in unison when you interact with one of the charts. For example, when you scroll the price and volume chart, the same adjustments made on this chart will be reflected on the liquidity chart and vice versa. Both charts will also display OHLC data. Liquidity is directly related to price impact and subsequently the cost of your trade. You can see the benefits and full detailed explanations of Trading Strategy’s OHLC liquidity chart here.
Trading Strategy CEO and Co-founder Mikko Ohtamaa states “Decentralised market data is different from the stock market. Tooling around the data is missing. ChartIQ is the only robust market data charting solution out there with flexibility and power for us to build the next generation price and liquidity charting for decentralised exchanges.”
ChartIQ integration
Trading Strategy is the first company to integrate ChartIQ into a SvelteKit application. Fortunately, the process was pretty straightforward.
SvelteKit manages dependencies as node modules that are bundled for deployment using Vite (similar to other build tools like webpack). The ChartIQ distribution ships with an npm compatible package which can be installed from the local filesystem:
$ npm install -P ../chartiq-8.6.0.tgzTrading Strategy leverages SvelteKit’s server-side rendering (SSR) wherever possible to optimise page-load times and SEO. Since there’s no benefit to server-side rendering for charts, we employed a client-side dynamic import technique, combined with a Svelte action to initialise the ChartIQ chart engine. Here’s a simplified version of our ChartIQ component:
<script>
  export let feed;
  export let symbol;

  let CIQ;

  // dynamically import CIQ
  async function initialize() {
    await import('chartiq/css/stx-chart.css');
    const module = await import('chartiq/js/chartiq.js');
    CIQ = module.CIQ;
    const { quoteFeed } = await import('chartiq/js/standard.js');
    CIQ.activateImports(quoteFeed);
  }

  // Svelte action to initialize CIQ widget
  function chartIQ(node) {
    const stxx = new CIQ.ChartEngine({ container: node });
    stxx.attachQuoteFeed(feed, { refreshInterval: null });
    stxx.loadChart(symbol);
  }
</script>

{#await initialize() then}
  <div use:chartIQ />
{/await}
For a fully-fledged component, you’ll likely want to return an update function from the action for reactive chart updates (e.g., when the symbol or periodicity changes), as well as a destroy function to tear-down the CIQ engine instance.
Once we validated the integration patterns outlined above, developing our charts was simply a matter of implementing the ChartIQ features that we had prioritised for our initial launch. We found ChartIQ’s documentation and support to be extremely helpful. You can view a live example of our charts for any crypto trading pair available on our platform – e.g. ETH-USDC. Our web frontend is open-source, so you can view our finished chart implementation here.
About Cosaic
Cosaic provides state-of-the-art software for firms that want to promote ingenuity, evolve intelligently, and improve end-user efficiency. Products include ChartIQ, the world-renowned financial charting software, and Finsemble, the world's first no-code smart desktop platform. As a workflow solutions provider, Cosaic is revolutionizing the way people work with over 300 global customers around the world, including Yahoo Finance, E*TRADE, Charles River, and Fidessa. Founded in 2012 as ChartIQ, Cosaic is a fast-growing firm based in Charlottesville, VA with offices in New York, London, and Hong Kong.
Visit cosaic.io for more information.
About Trading Strategy
Trading Strategy is an algorithmic trading solution for decentralised markets, enabling automated trading using a blockchain protocol-based approach. Learn more about Trading Strategy in the introduction post.
Join Trading Strategy community Discord to discuss decentralised finance, technical analysis and algorithmic trading.